The U.S. stock market has had a rough couple of weeks. Well, more than just a couple.
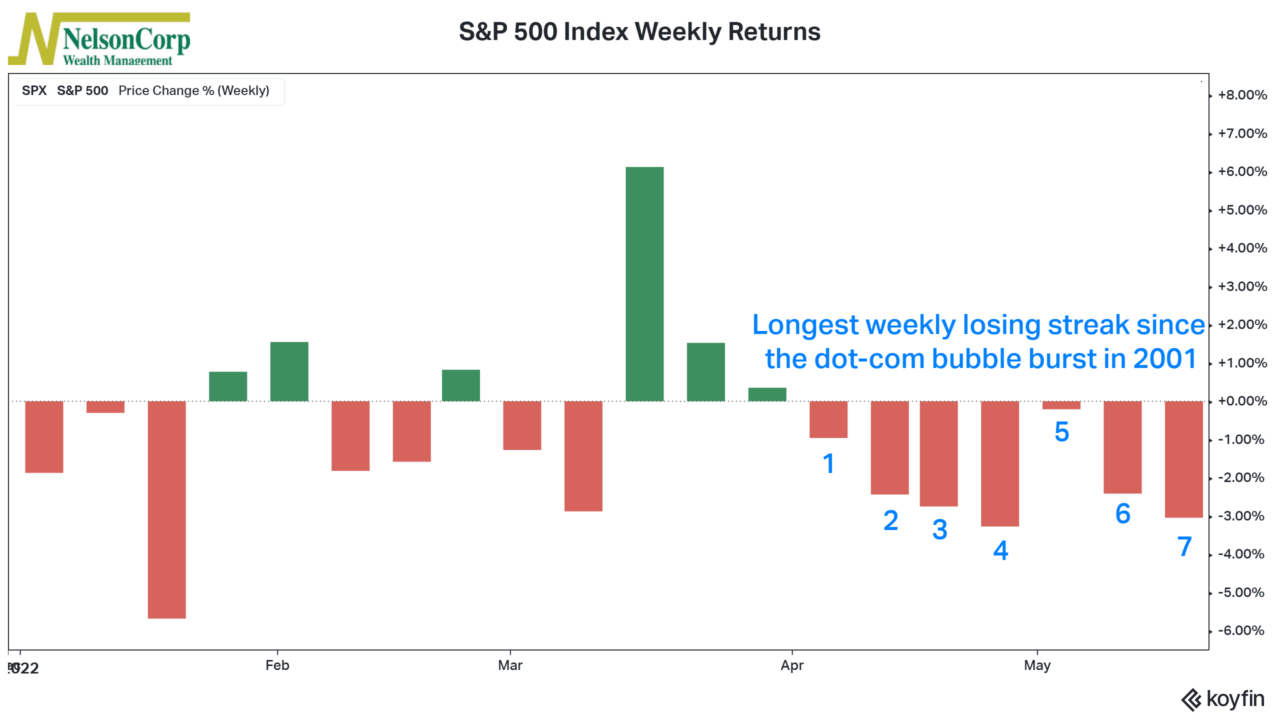
Our Chart of the Week above shows the weekly returns for the S&P 500 this year. The index has now closed lower for its seventh week in a row. You would have to go all the way back to 2001—in the midst of the dot-com crash—to see a weekly losing streak that long. (The S&P 500 fell eight consecutive weeks in the first quarter of 2001.)
The good news is that after all these relentless declines, stocks are starting to look cheaper relative to their underlying earnings. The bad news, however, is that this sort of price action tends to be followed by periods of weaker returns for at least a few more months.
The sample size is admittedly small, but the average return for the S&P 500 six months after a losing streak of six or more weeks is around -1.2%. That’s not terrible, but it’s not exactly encouraging either. Plus, the range of returns around that average is quite wide. So, we expect the range of potential outcomes in the stock market to continue to be wide during this period of extreme uncertainty.
This is intended for informational purposes only and should not be used as the primary basis for an investment decision. Consult an advisor for your personal situation.
Indices mentioned are unmanaged, do not incur fees, and cannot be invested into directly.
Past performance does not guarantee future results.