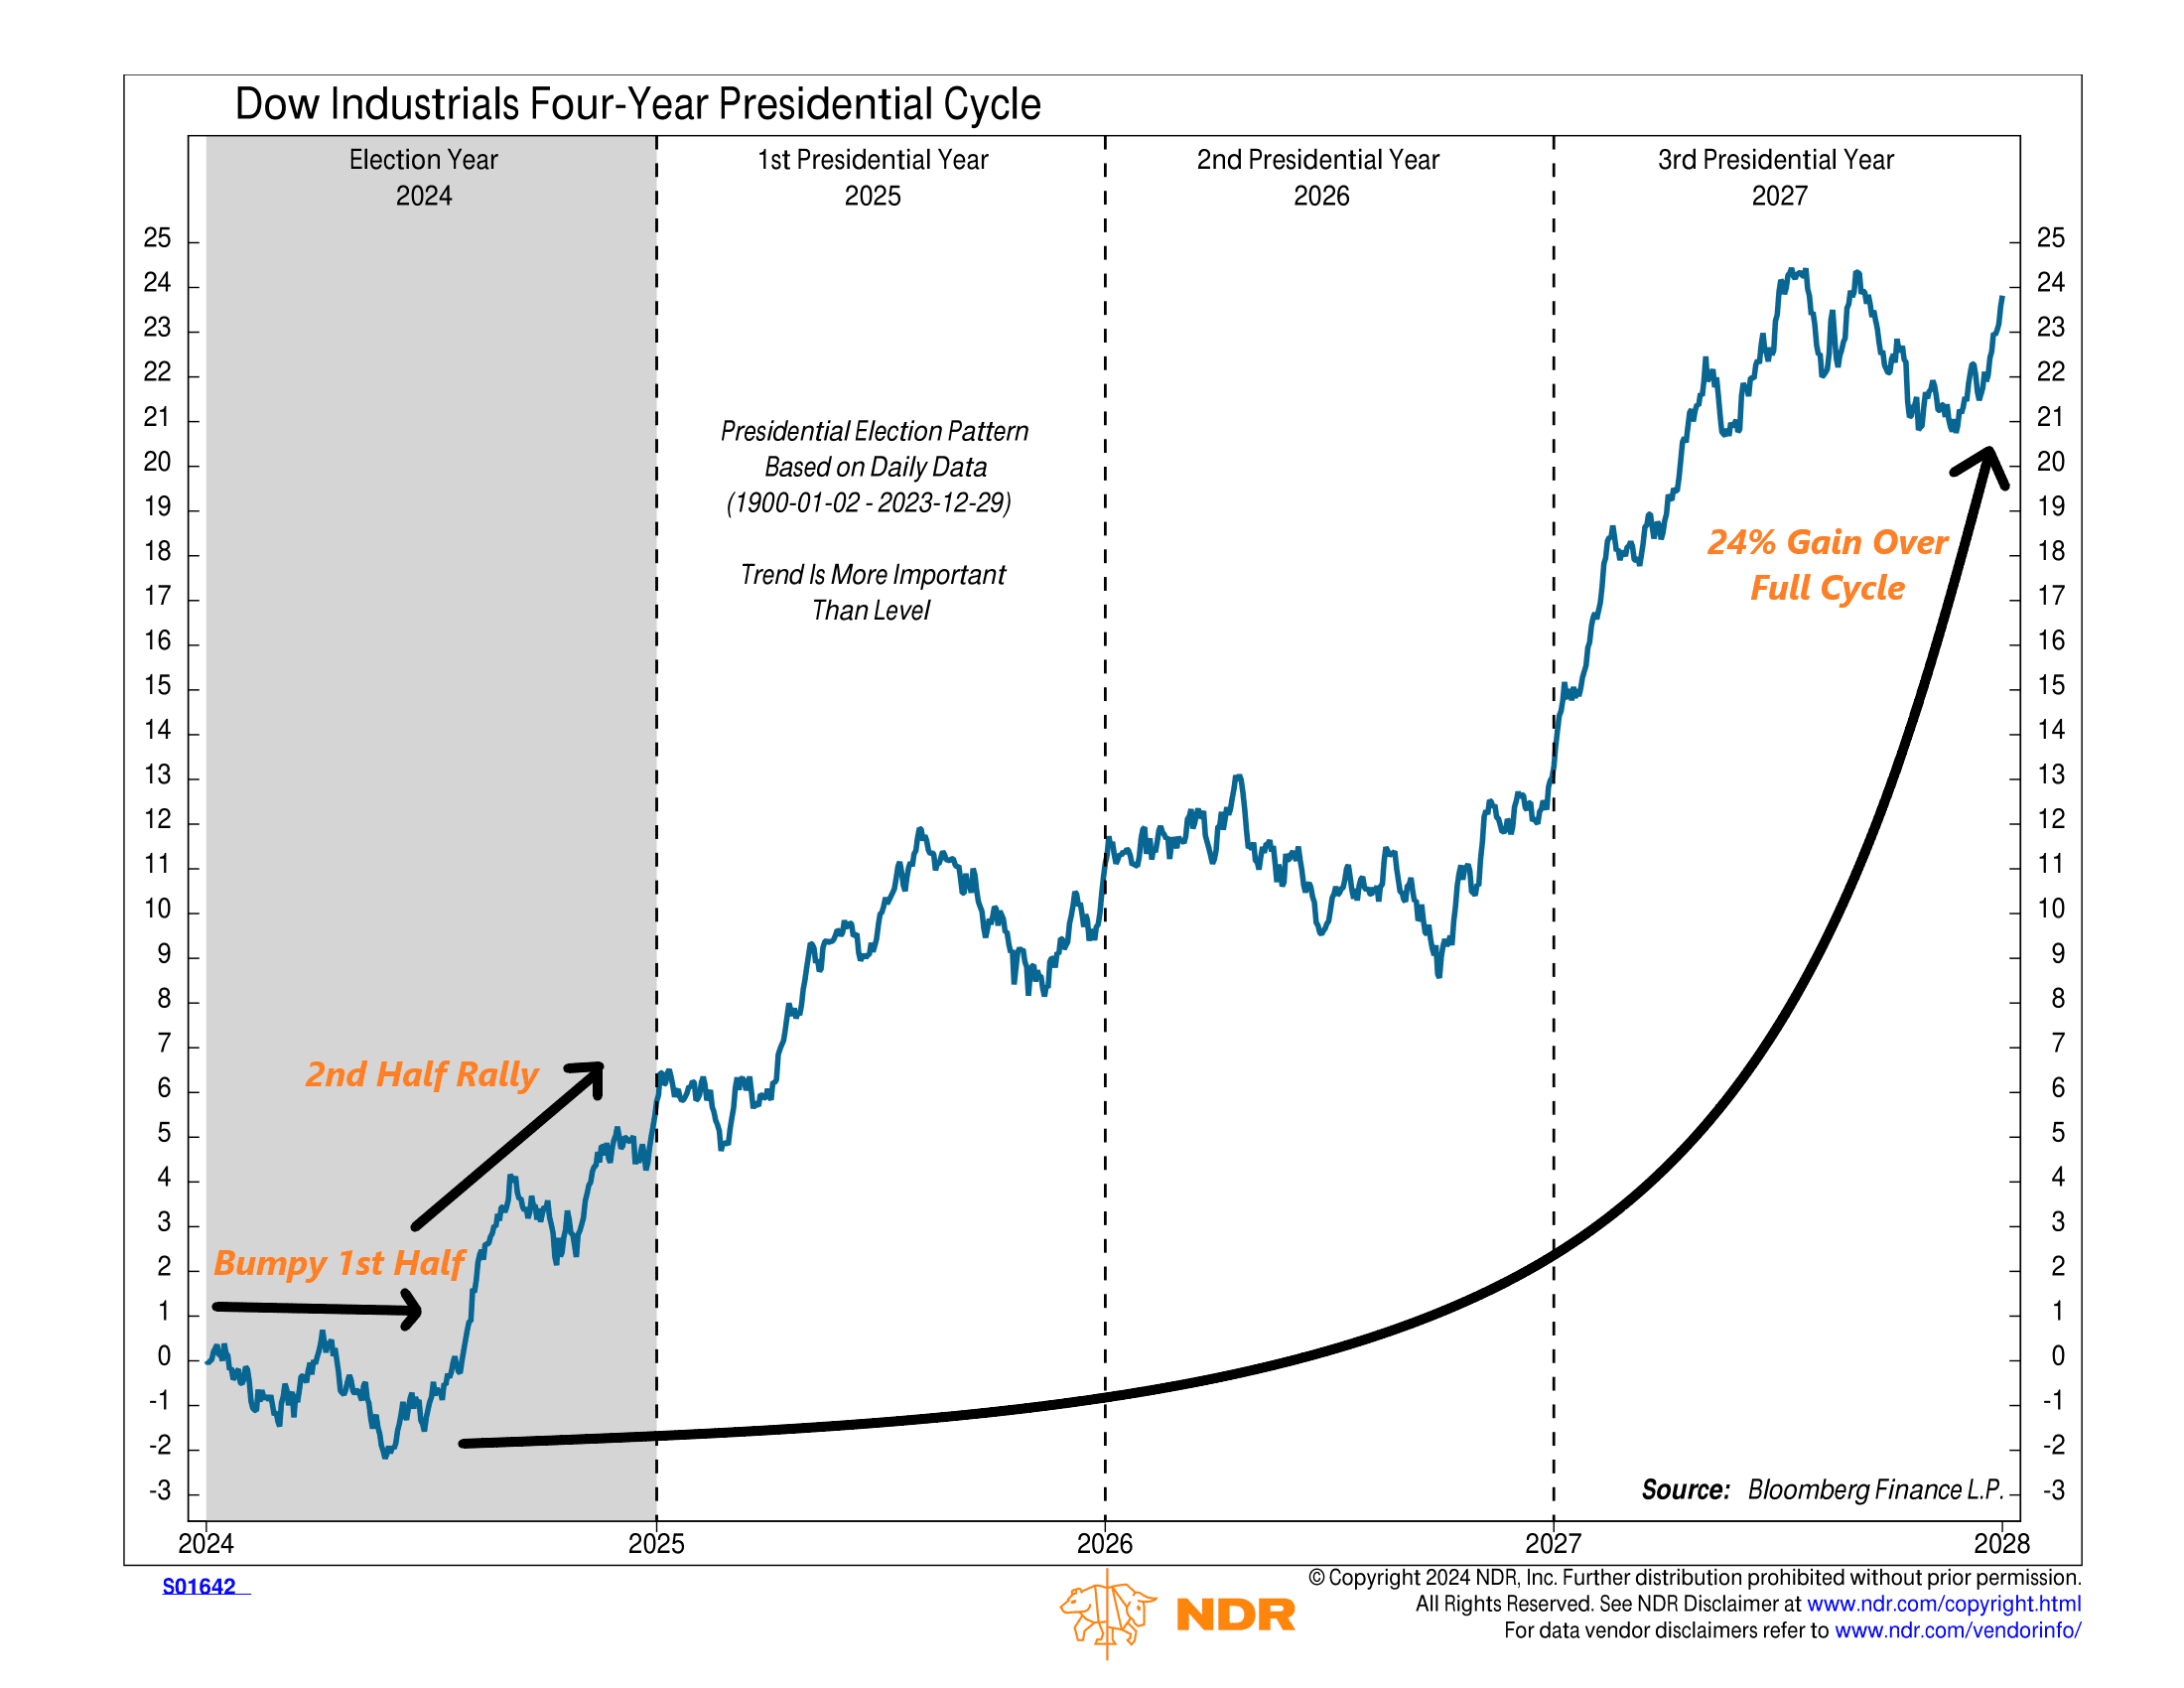
Have you ever wondered how the stock market does during a presidential election year? Well, let’s take a look! This week’s chart shows how the Dow Jones Industrial Average, which is used as a representation of the stock market, typically performs over a complete four-year election cycle.
The chart is split into four sections, each representing a year of the election cycle. The first year is the election year itself. The blue line on the chart displays the Dow’s average return during each of these presidential years, dating back to 1900.
A few interesting things stand out. For one, you can see how the first half of an election year can be a bit turbulent, with the Dow often moving sideways or even dipping. But as the year progresses and the uncertainty surrounding the election clears up, the market tends to bounce back and rally strongly. Something to keep in mind for the rest of this year!
Another significant finding is that the market tends to see a substantial increase over the entire four-year election cycle, averaging about 24%. This is an important observation because investors could be tempted to time their investments based on who’s in the White House. But the data suggests otherwise. Whether it’s Democrats or Republicans steering the ship, the market generally keeps chugging along, rewarding those who stay invested regardless of political affiliation.
This is intended for informational purposes only and should not be used as the primary basis for an investment decision. Consult an advisor for your personal situation.
Indices mentioned are unmanaged, do not incur fees, and cannot be invested into directly.
Past performance does not guarantee future results.
The Dow Jones Industrial Average (DJIA) is a price-weighted index composed of 30 widely traded blue-chip U.S. common stocks.
