There’s an adage on Wall Street that goes something like, “Sell in May and walk away.”
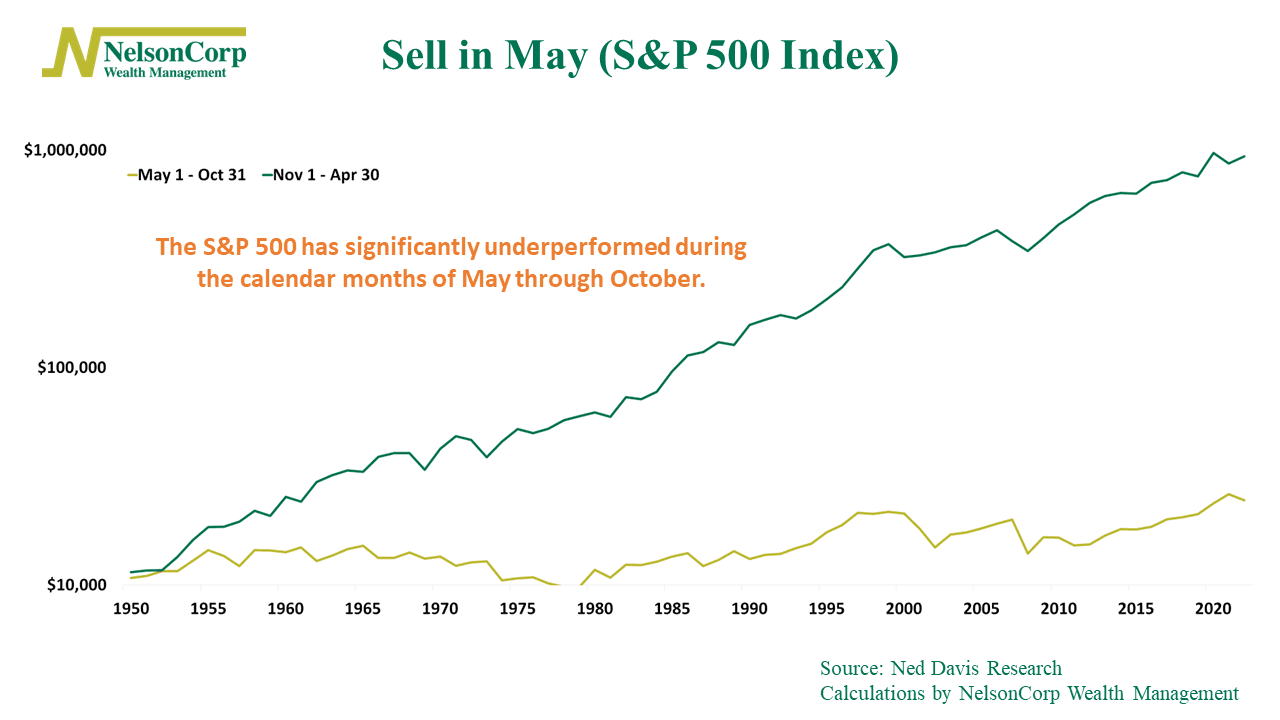
It refers to the stock market’s tendency to underperform for the six calendar months of May through October and outperform from November through April.
Just how big is the variance in performance between the best and worst six months?
Very big.
The difference in performance between these two periods has been quite significant over the past 70+ years, as illustrated in the featured chart. If you had invested $10,000 in the S&P 500 index during the November to April period starting in 1950, your investment would have grown to nearly $1 million (shown by the green line). On the other hand, investing during the months of May through October would have only resulted in an amount of about $25,000 (represented by the gold line).
One justification for this phenomenon is that as the weather improves, investors focus less on the stock market and more on the great outdoors and vacations. Perhaps that’s true.
For investors, the concern is that this seasonally weak period is now overlapping with several other headwinds this year—including late innings for the Fed and the economic cycle, the debt ceiling, and high levels of complacency in the stock market as measured by the VIX Index.
The bottom line: Although seasonal trends are not explicitly incorporated into our modeling process, we find it important to acknowledge and be aware of them alongside the other factors that we monitor more closely.
This is intended for informational purposes only and should not be used as the primary basis for an investment decision. Consult an advisor for your personal situation.
Indices mentioned are unmanaged, do not incur fees, and cannot be invested into directly.
Past performance does not guarantee future results.