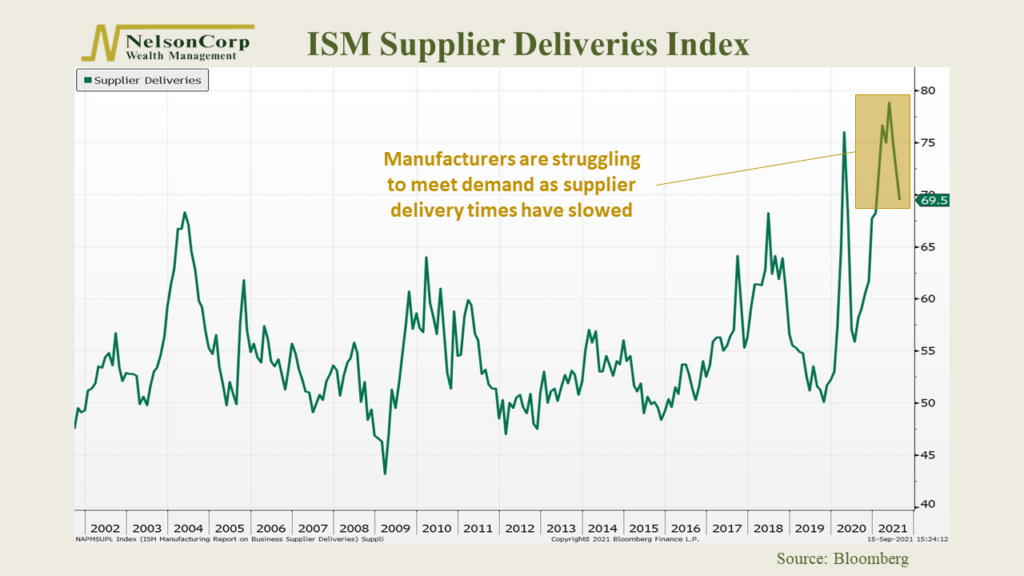
This week’s featured chart is the ISM Supplier Deliveries Index. It measures whether suppliers are taking longer or shorter to deliver materials to manufacturers. It’s an inverse index, meaning a reading above 50% indicates slower delivery times, and below 50% indicates faster delivery times. The recent reading in August was 69.5%, down from a high of nearly 80% in May but still quite elevated relative to history.
The reason for this comes down to a major theme this year: shortages. When the pandemic hit, suppliers of raw materials cut back production in anticipation of disappearing demand. But then economic demand came roaring back faster than expected, and now suppliers are struggling to meet that demand.
Take microchips, for example. In our technology-focused world, they are more important than ever. But there is a big supply shortage of chips right now. This makes it harder for manufacturers to meet the demand for all those great consumer products we rely upon today, like our smartphones and automobiles.
It’s all just bad business. When demand is outstripping supply, companies might have to raise prices to maintain their profit margins. However, if they can’t or don’t want to raise prices, it will hurt their bottom line. Additionally, if they can’t get the materials they need to produce their product, they might miss out on potential revenue streams.
Hopefully, delivery times will speed up in the future as supply comes back online and the economy finds a more stable equilibrium.
This is intended for informational purposes only and should not be used as the primary basis for an investment decision. Consult an advisor for your personal situation.
Indices mentioned are unmanaged, do not incur fees, and cannot be invested into directly.
Past performance does not guarantee future results.