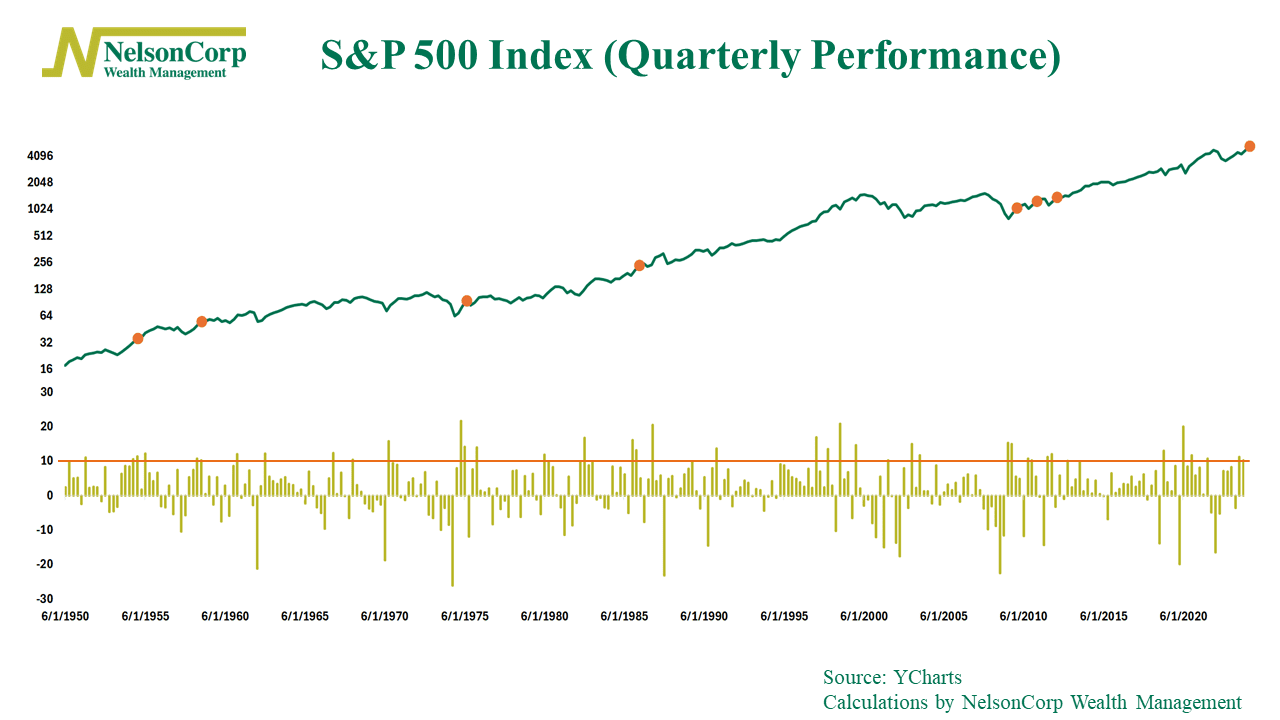
We closed out the first quarter last week—and it was a good one. Over the first three months of the year, the S&P 500 stock Index rose 10.16%. The three months before that, it was up 11.24%.
That’s back-to-back quarterly gains of 10% or more for the first time since March 2012. In fact, as our chart above shows, that was just the 8th time since 1950 that the stock market has posted back-to-back quarterly gains of 10%+.
The orange dots on the chart mark when these rare back-to-back quarterly gains have occurred throughout history. What’s interesting is that these tend to happen when the market is trending upward. In other words, it’s bullish.
This finding may be a bit unexpected. But it underscores the idea that the stock market exhibits momentum from time to time, where strong price increases are followed by more price gains.
As they say, strength begets strength—and that applies to the stock market, too.
This is intended for informational purposes only and should not be used as the primary basis for an investment decision. Consult an advisor for your personal situation.
Indices mentioned are unmanaged, do not incur fees, and cannot be invested into directly.
Past performance does not guarantee future results.
The S&P 500 Index, or Standard & Poor’s 500 Index, is a market-capitalization-weighted index of 500 leading publicly traded companies in the U.S