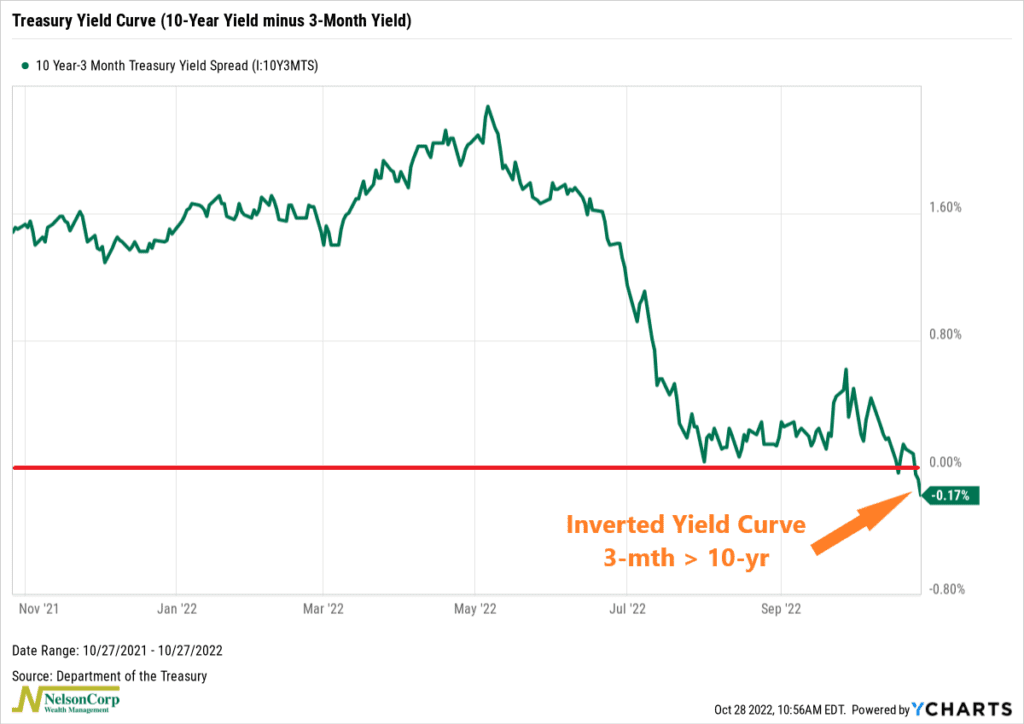
Well, it finally happened. Of all the leading indicators flashing red for the economy, the 3-month/10-year Treasury yield curve was one of the few to remain positive—until now.
As our featured chart shows, the 3-month/10-year Treasury yield curve inverted this week. This means that the rate on the 3-month Treasury bond—a good proxy for short-term interest rates—is now higher than the rate on the 10-year Treasury bond.
In other words, when we take the 10-year Treasury yield and subtract the 3-month Treasury yield, we get a negative number. In the financial world, this is called a yield curve inversion.
Normally, it’s the other way around. Rates on longer-duration debt tend to carry higher rates than shorter-duration debt; this compensates investors for time and various other risks.
However, when these rates invert, it’s a sign that something is off. Investors are getting nervous about the future state of the economy, and historically, a yield curve inversion has been a reliable sign that the economy is about to enter a recession.
The 3-month/10-year yield curve inversion is a particularly important one, too. That’s because it has accurately predicted the past eight recessions. After an inversion, a recession is typically a little less than two years away.
The bottom line? Investors tend to perk up and notice when they see this yield curve spread go negative.
This is intended for informational purposes only and should not be used as the primary basis for an investment decision. Consult an advisor for your personal situation.
Indices mentioned are unmanaged, do not incur fees, and cannot be invested into directly.
Past performance does not guarantee future results.