This week’s featured indicator looks at the stock market’s median price-to-earnings (P/E) ratio to measure valuation.
For those unfamiliar, the P/E ratio is the price of a stock divided by its earnings per share. The higher the ratio, the more investors are currently paying for each dollar of underlying earnings generated by the company. The lower the ratio, the less investors are paying. Therefore, this indicator is a way to measure sentiment, as high valuations indicate high optimism, and low valuations suggest pessimism.
Our philosophy, however, is that sentiment extremes tend to signal market turning points.
The historical record of this indicator backs up this insight.
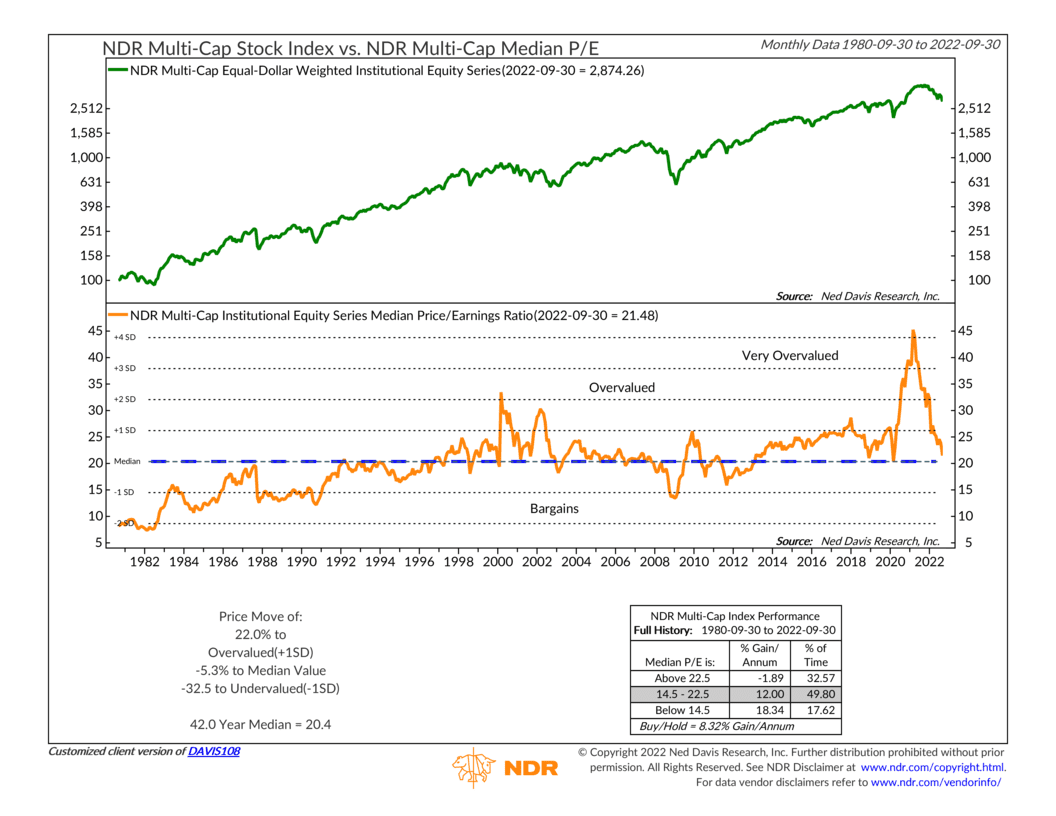
The orange line on the bottom clip of the chart shows the P/E ratio of the median or average institutional grade stock in the U.S. stock market. Extreme deviations from the norm, or median (middle blue dashed line), signal high or low-risk periods. Historically, stocks have performed better when the median P/E ratio is below the 42-year average (about 20.4) than when valuations are far above the norm.
Specifically, when valuations are above a P/E ratio of 22.5, stocks return nearly -1.9% per year. Between 14.5 and 22.5, however, stocks produce a much better 12% return per year. And when valuations are under 14.5, stocks generate their best annualized returns at over 18%.
Looking at the chart, we can see just how extreme valuations got during the 2021 run-up in stock prices. In April 2021, the median stock’s P/E ratio was more than 4 standard deviations above its historical average! This was a major warning sign that future stock returns would be poor. Indeed, since then, the S&P 500 index is down roughly 10%.
The good news, however, is that this correction has left the market in “better bargain” territory. The median P/E ratio is now under 21.5, which is considered neutral territory according to this indicator.
To be sure, the stock market can still get cheaper from here, meaning prices could absolutely move lower in the short to intermediate term. That’s why these valuation-type indicators are generally poor timing tools. But, from a long-term perspective, the market is likely a better bargain at these current levels than it was a year and a half ago.
This is intended for informational purposes only and should not be used as the primary basis for an investment decision. Consult an advisor for your personal situation.
Indices mentioned are unmanaged, do not incur fees, and cannot be invested into directly.
Past performance does not guarantee future results.