Bonds have had a rough time the past few years. The Fed started raising cash rates in 2021 to tackle inflation, and bond returns suffered severely. But, according to this week’s featured indicator, things are starting to look up for bonds.
The indicator is called a bond/cash composite model. It blends different indicators to determine whether bonds will outperform cash or vice versa. It looks at “internal” metrics, like the trend in the bond/cash ratio over time, and “external” factors, such as Fed policy and inflation.
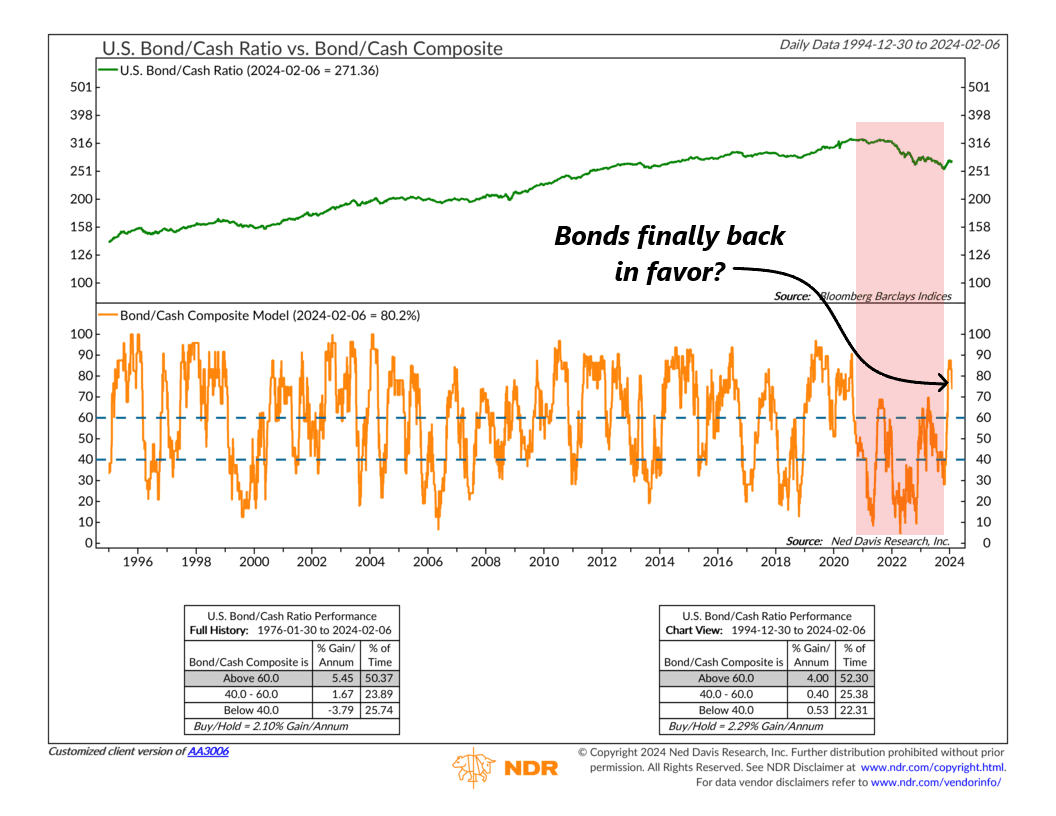
In the model’s chart, the green line shows the ratio of bond returns to cash returns. When it rises, bonds are doing better than cash; when it falls, cash is stronger. The orange line represents the model’s overall score, ranging from 0% to 100%. Readings above 60% favor bonds, below 40% favor cash, and between 40% and 60% suggest a neutral stance.
So, what is the model saying now? Well, after a few years of sub-60% readings (meaning cash was either favored or neutral relative to bonds), the model has jumped sharply into the upper bullish zone for bonds. A few things are responsible for this jump, but it ultimately comes down to what appears to be a reversal in the bond/cash price ratio, as well as continued improvements in the various external factors, like inflation and Fed policy.
The bottom line? According to this model, bonds will likely do well in the current environment. This presents an opportunity for investors who have heavily favored cash in recent years to perhaps reconsider their investment strategy.
This is intended for informational purposes only and should not be used as the primary basis for an investment decision. Consult an advisor for your personal situation.
Indices mentioned are unmanaged, do not incur fees, and cannot be invested into directly.
Past performance does not guarantee future results.