Investors have long been searching for ways to forecast stock returns.
But with so much data available, it can be overwhelming.
An easy solution is to simplify the process.
One approach that has proved particularly useful over the years is the use of moving averages, specifically the 50-day and 200-day moving averages of the S&P 500 Index.
These moving averages represent the average price of the index over their respective time periods, with 50 days being a little over 2 months of trading and 200 days being about 9 ½ months of trading.
Historically, when the 50-day moving average is above the 200-day moving average, it’s a sign that the market is rising in the short term relative to the longer term, a bullish (positive) sign for the market. However, when the 50-day moving average is below the 200-day moving average, it’s a bearish sign for the market, meaning market gains tend to be lower.
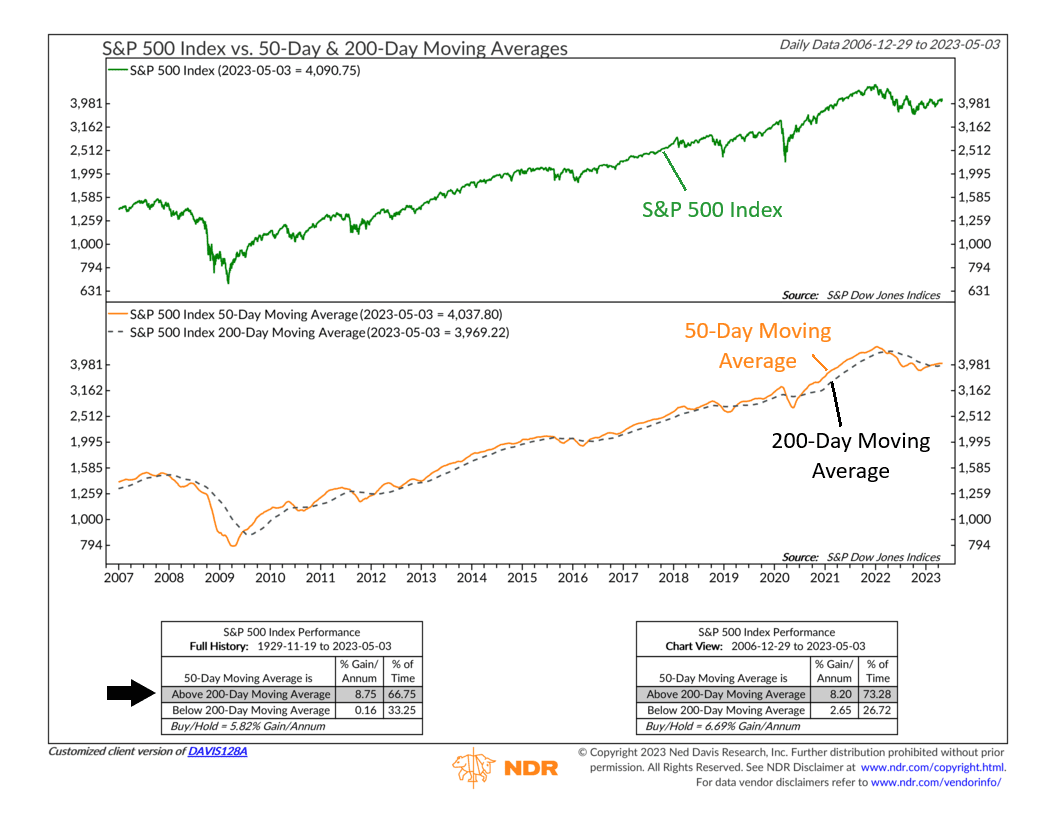
On the chart above, you can see how the S&P 500 Index (green line) tends to trend upward when the 50-day moving average (orange line) is above the 200-day moving average (black dashed line). But the stock market tends to struggle when the opposite occurs.
As the left performance box on the bottom of the chart reveals, going as far back as 1929, the S&P 500 averages an 8.75% per annum gain when this indicator is positive versus a paltry 0.16% per annum gain when the indicator is negative.
The good news is that after the S&P 500’s rough year last year, the indicator is back into its bullish zone for the first time since March 2022. If this holds, it will be an encouraging sign that the market’s internal health is healing.
So, the bottom line? When combined, a couple of simple moving averages can form a powerful tool in an investor’s toolbox. It’s not fancy, but it works. Most of the time, the stock market is going to go where it goes regardless of external factors, so it pays to have a way of capturing the trend when it forms.
This is intended for informational purposes only and should not be used as the primary basis for an investment decision. Consult an advisor for your personal situation.
Indices mentioned are unmanaged, do not incur fees, and cannot be invested into directly.
Past performance does not guarantee future results.
