The stock market has been in a slump for the past few months. However, a rally over the past couple of weeks has been so strong that it looks like the market might have just dodged the dreaded “death cross.”
What is a death cross? It’s a term used in technical analysis to describe the bearish crossover of two moving averages. Specifically, it describes when the 50-day moving average of the S&P 500 Index crosses below the 200-day moving average. When this occurs, it indicates that the average price over the short term is falling faster than the average over the long term, reflecting a shift in the market’s overall trend toward a more negative direction.
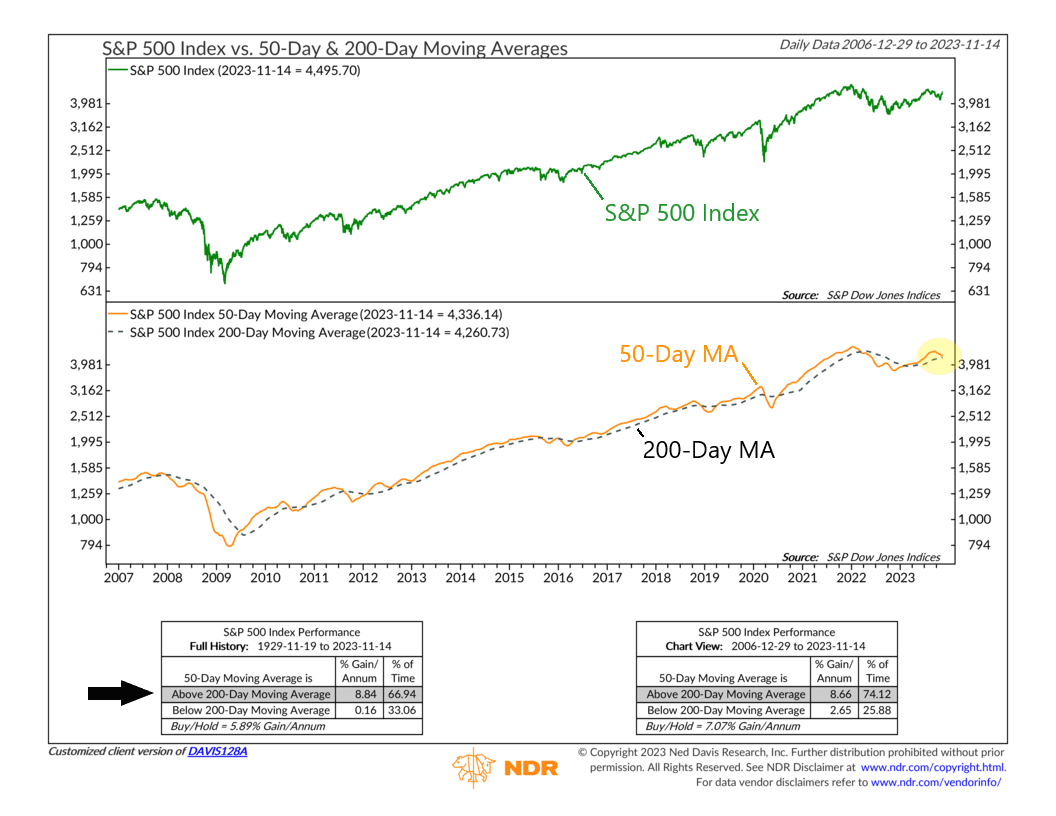
This is bad. As our featured indicator above shows, when the 50-day average (orange line) falls below the 200-day average (black dashed line), returns for the S&P 500 Index (green line) have been poor. Going back to 1929, returns for the S&P 500 have been just 0.16% per year when the death cross has been active.
But the good news is that, so far, the market has managed to avoid the death cross. It’s gotten close, but the recent rally in stocks has stopped the decline in the shorter-term 50-day average.
If the 50-day average can manage to stay above the 200-day average—a golden cross—then the market should be able to do well. Historically, average returns for the S&P 500 Index have been nearly 9% per annum when in the golden cross position.
The bottom line? While no indicator is perfect, a simple indicator like this one can help us see the “big picture” of the market and how prices are moving. If prices over the near term are falling faster than prices over the long term, that’s generally not great. On the other hand, short-term strength relative to the long-term trend is usually positive. Understanding this helps us manage risk and ensure that we stay on the right side of the market’s trend.
This is intended for informational purposes only and should not be used as the primary basis for an investment decision. Consult an advisor for your personal situation.
Indices mentioned are unmanaged, do not incur fees, and cannot be invested into directly.
Past performance does not guarantee future results.
The S&P 500 Index, or Standard & Poor’s 500 Index, is a market-capitalization-weighted index of 500 leading publicly traded companies in the U.S.