This week’s indicator looks at the percentage of U.S. companies beating earnings expectations—or what is commonly called the “beat rate” on Wall Street.
The key insight of the indicator is that when more companies beat earnings expectations in a quarter, it usually leads to better returns in the stock market.
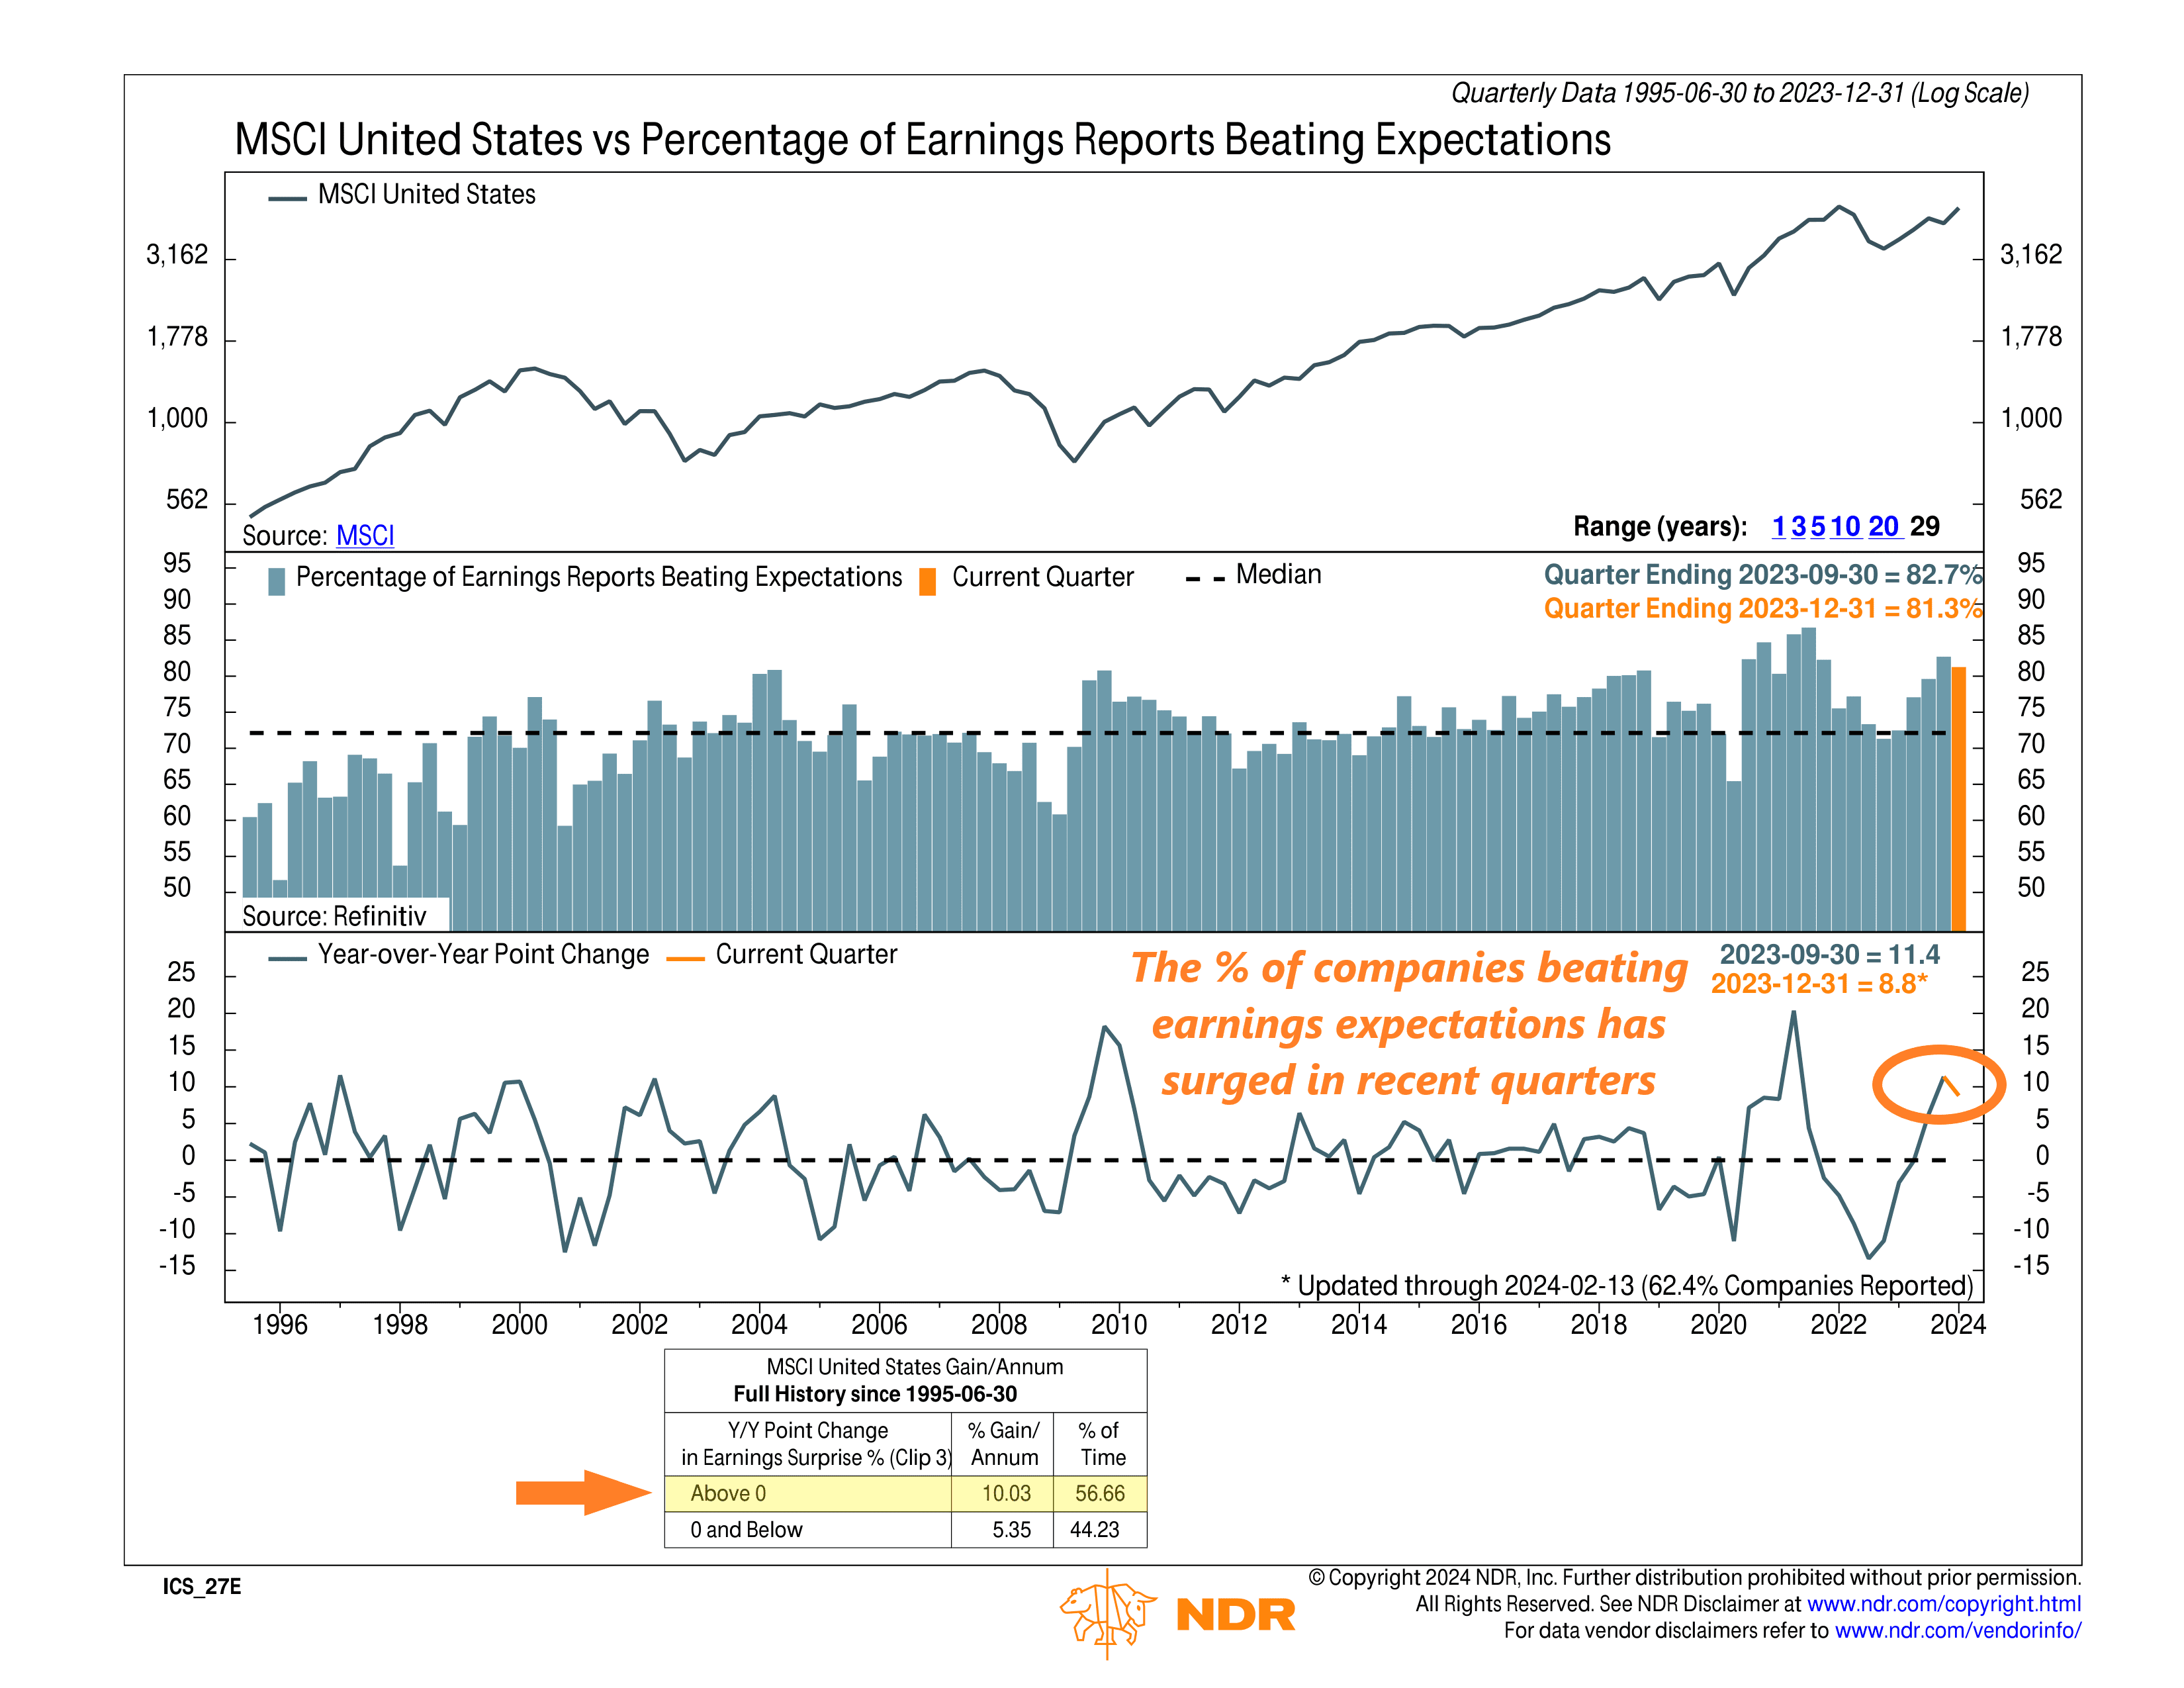
Here’s the chart’s breakdown:
At the top, we have our stock market index, specifically the MSCI United States Index, which keeps tabs on how large and mid-cap U.S. stocks are doing.
In the middle section, we see historical earnings beat rates dating back to 1995. The orange bar represents the latest quarter, which wrapped up on December 31, 2023. Right now, it’s sitting at 81.3%. Translation? Over 80% of companies reporting earnings for that quarter exceeded what Wall Street predicted they’d earn.
How does that stack up with the historical average? The dashed black line shows that the average earnings beat rate has been just under 75% historically. So, more companies are surpassing expectations than usual.
We’d expect this to be a positive for stock returns, and that is indeed what the historical record reveals. The bottom segment of the chart shows the year-over-year change in the beat rate. When it’s been above zero, it has historically resulted in strong annualized gains for U.S. stocks—to the tune of about 10%, on average. Currently, it’s about 8.8%—well above zero—so we are clearly in a robust earnings environment.
So, what’s the bottom line? Earnings play a significant role in how well stocks perform. When companies outdo what the street expects, it’s usually good news for stock prices.
This week’s indicator points out that even though the stock market might seem top-heavy in terms of market cap, there are still plenty of companies out there beating expectations—and that could spell good things for the overall market.
This is intended for informational purposes only and should not be used as the primary basis for an investment decision. Consult an advisor for your personal situation.
Indices mentioned are unmanaged, do not incur fees, and cannot be invested into directly.
Past performance does not guarantee future results.
The MSCI USA Index is designed to measure the performance of the large and mid-cap segments of the US market. With 609 constituents, the index covers approximately 85% of the free float-adjusted market capitalization in the US.