They say valuation—like beauty—is in the eye of the beholder. But we can still objectively value the stock market by comparing it to another asset, and that’s the goal of this week’s featured indicator.
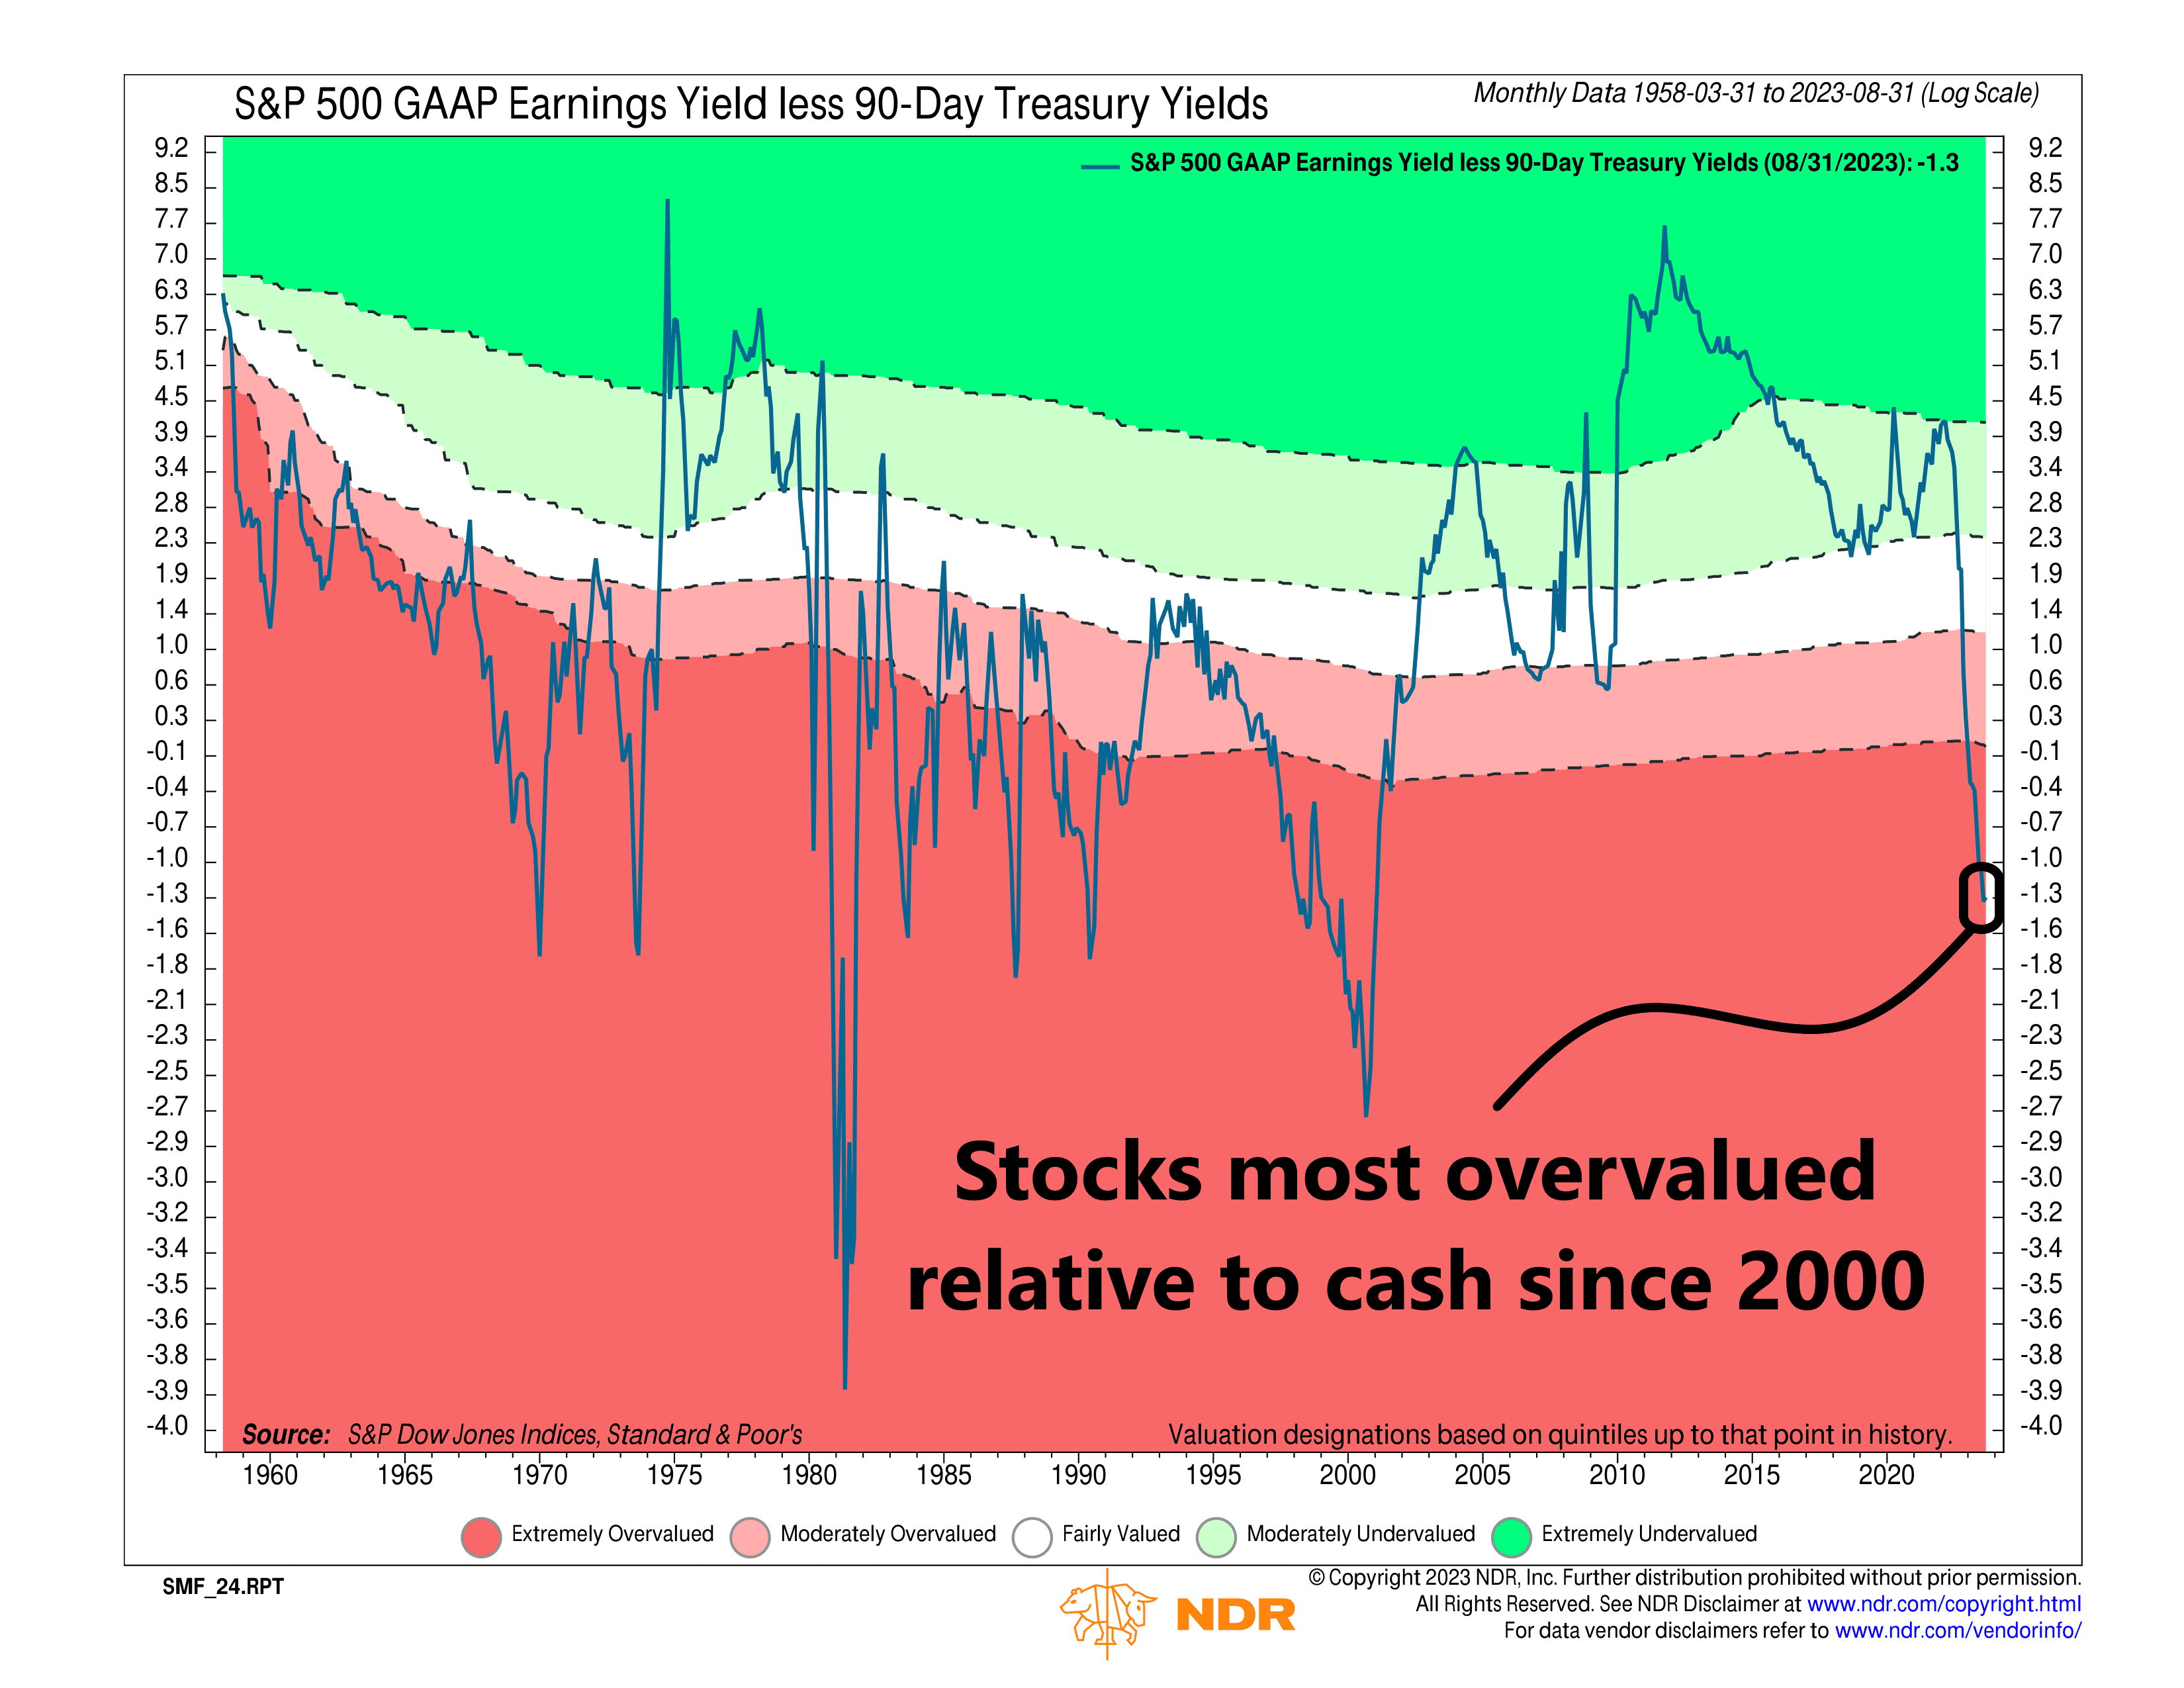
Specifically, the indicator compares stocks to a safe asset like cash. It does this by taking the S&P 500’s GAAP earnings yield—earnings per share divided by price—and subtracting the 90-day Treasury yield. In other words, it generates a relative valuation line by subtracting cash yields from stock yields.
This is the dark blue line on the chart. When it’s greater than 1, it means stocks are yielding more than cash. If it gets into the upper green shaded areas, it’s a sign that stocks are historically undervalued relative to cash. In theory, you’d want to own stocks over cash in this scenario. However, when the line is less than 1 and gets into the lower red shaded areas, it’s a sign that stocks are historically overvalued relative to cash. In that case, cash would look like a better investment option.
What’s the indicator saying now? Well, for stocks, it’s not great. After last month’s update, the relative valuation line is down to -1.3. As you can see, this means stocks are now the most overvalued (expensive) relative to cash since 2000 (the dot-com bubble).
Mostly, this is a function of rising cash yields. Since the Fed started raising interest rates last March, the S&P 500 GAAP earnings yield less 90-day Treasury yield has gone from being on the verge of being extremely undervalued (dark green shaded area) to being extremely overvalued (dark red shaded area).
In other words, higher cash rates have raised the required rate of return to own risky assets like stocks. Investors are now asking themselves, why risk capital on risky stocks when I can get a roughly 5.6% yield on risk-free cash? Sure enough, over $1 trillion in new money has flowed into money market mutual funds since March 2022.
So, the bottom line is that investors are looking at stocks versus cash in a way they haven’t in a very long time—and they’re clearly liking what they see in cash.
This is intended for informational purposes only and should not be used as the primary basis for an investment decision. Consult an advisor for your personal situation.
Indices mentioned are unmanaged, do not incur fees, and cannot be invested into directly.
Past performance does not guarantee future results.