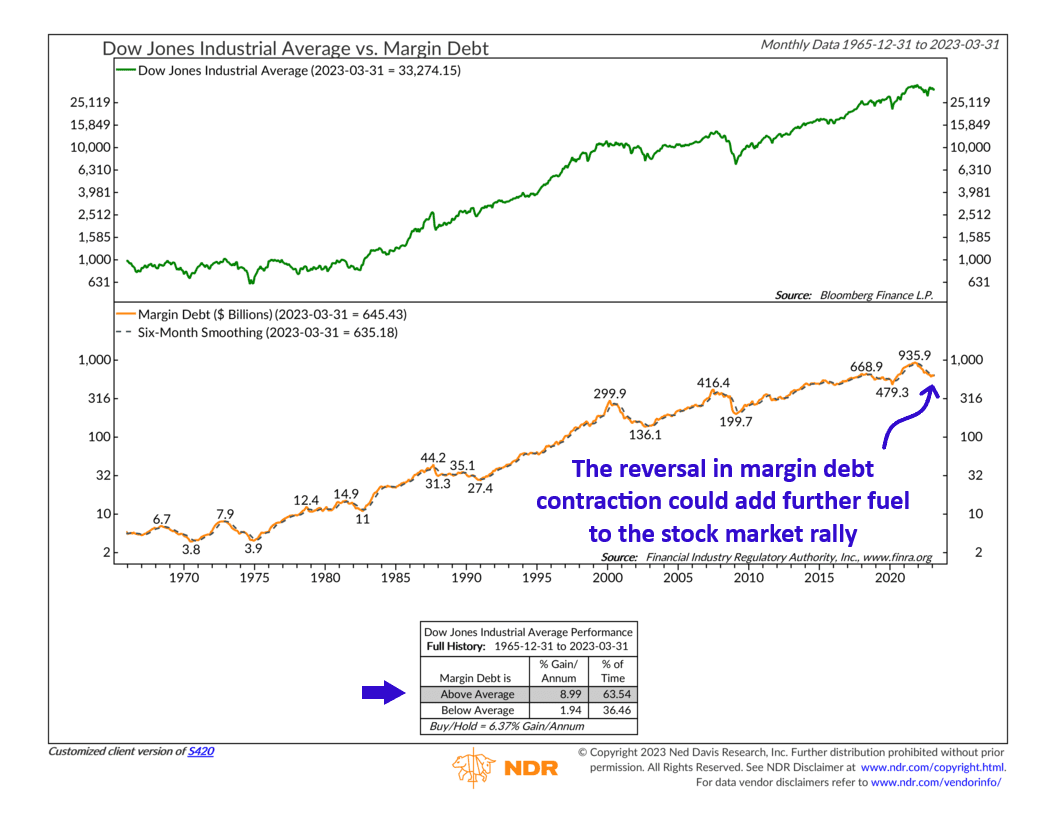
Margin debt is the topic of this week’s indicator. What is margin debt? It’s simply money borrowed from a broker for the purpose of buying stock. Typically, you see it used by speculators who wish to leverage their stock purchases, making it a great gauge of speculation and liquidity.
In our chart above, we show the Dow Jones Industrial Average—a proxy for the U.S. stock market—as the green line on the top clip. On the bottom clip, the orange line represents the total amount of margin debt owed to brokerage firms, in billions of dollars.
Historically, we’ve found that rising margin debt has a strong correlation with a rising stock market and vice versa. To determine the trend, the chart also uses a 6-month moving average of margin debt, shown as the black dashed line. When margin debt rises above the 6-month moving average, it triggers a buy signal for the Dow, whereas a fall below the 6-month moving average triggers a sell signal. Going back to 1965, buy signals have resulted in roughly 9% per annum gains for the Dow versus roughly 2% per annum gains after sell signals.
What this chart is also telling us is that, historically, stocks tend to struggle soon after a surge in margin debt, and they tend to rally soon after a significant contraction in margin debt. The application of the 6-month moving average, however, ensures that signals aren’t generated until the trend has sufficiently reversed.
For example, during the Great Financial Crisis, margin debt contracted considerably. But by April 2009, margin debt had climbed back above its 6-month moving average, triggering a buy signal and marking the beginning of a bull market for the Dow.
In other words, margin debt can be seen as potential fuel for a bull market. After a significant contraction in margin debt, the stock market tends to bottom, and speculators return to take advantage of the market’s advance, reinforcing the bull market and confirming the price action.
So, what is the indicator telling us now? The recent rise in interest rates has encouraged investors to take on less margin debt, resulting in a struggling stock market. Margin debt contracted considerably from its peak in October 2021, reaching a low of about $600 billion by the end of last year. However, it is starting to rise again. Last month, it was back to about $645 billion, placing it above its 6-month moving average and triggering a buy signal.
Is this the potential fuel the stock market needs to keep the rally going? We’ll see. But the bottom line is that margin debt can significantly impact stock market movements. While it is not the only factor to consider, it is an important indicator to be aware of, and it can help confirm or deny major stock market movements.
This is intended for informational purposes only and should not be used as the primary basis for an investment decision. Consult an advisor for your personal situation.
Indices mentioned are unmanaged, do not incur fees, and cannot be invested into directly.
Past performance does not guarantee future results.