For this week’s indicator, we’re going to take a look at stock market earnings and how they can be used to forecast stock market returns.
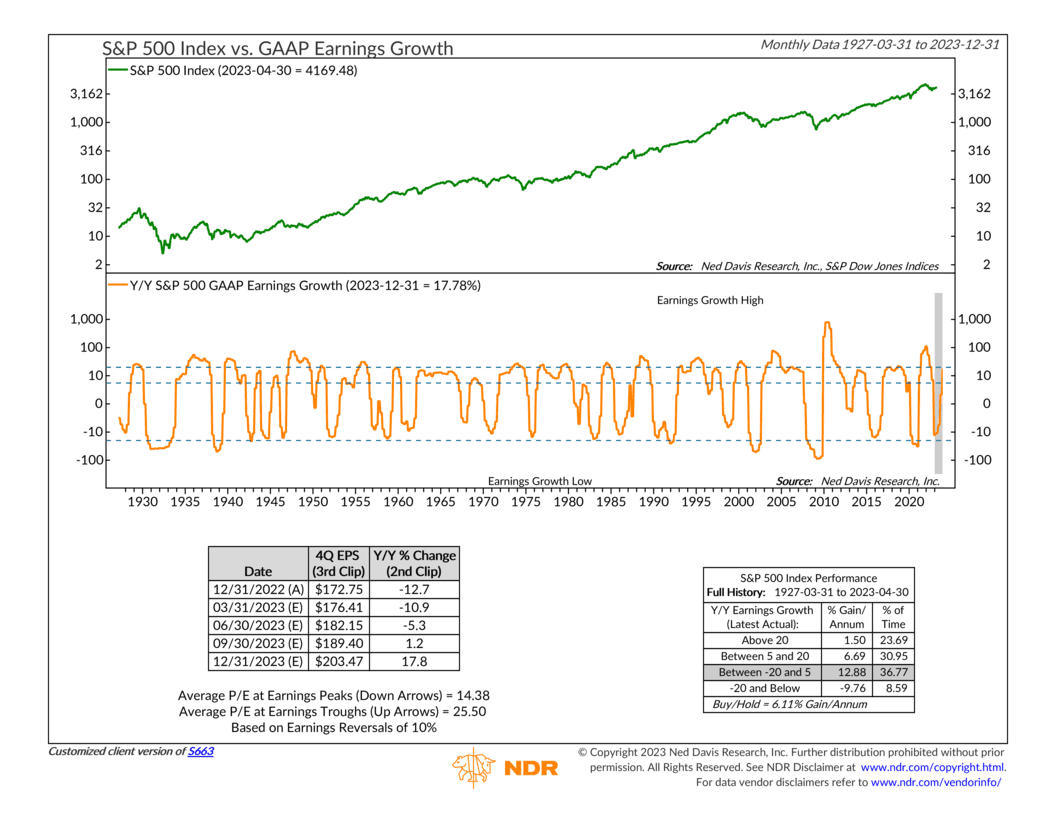
In the top part of the chart above, we have plotted the S&P 500 Index’s monthly close (green line), which we’ll be using as a proxy for the stock market’s returns. The orange line in the lower section of the chart represents the year-to-year growth rate in S&P 500 reported (GAAP) earnings per share.
The first thing that stands out is that the year-to-year growth rate in earnings oscillates around its long-run average of 7%-12%. As you can see, the earnings growth rate moves in waves, with periods of high readings followed by periods of low readings.
But the most interesting observation has to do with the results of the performance box on the bottom right of the chart. It reveals that when the year-to-year earnings growth rate is high, stock returns tend to be low, while low earnings growth rates coincide with above-average stock returns.
This outcome contradicts the conventional wisdom that stocks do well when earnings are strong and vice versa. In reality, by the time earnings are officially reported, investors have already factored them into their projections and are focused on the next cycle. Thus, unless earnings are exceptionally poor, with a year-to-year growth rate of 20% or lower, a low reported earnings growth rate generally indicates favorable future stock returns.
For instance, as depicted on the far right of the chart, the most recent reported year-to-year change in earnings (4Q, 2022) appears to have bottomed out around -13%. This is due to Wall Street estimates suggesting that earnings are expected to increase over the upcoming quarters, as indicated by the shaded area on the chart. In other words, the earnings slowdown might reverse course this year, narrowly avoiding the -20% threshold that would have indicated significantly poor stock returns.
Furthermore, current and projected growth rates are anticipated to remain below 20% but above -20% for the remainder of the year. As indicated by the performance box, in such cases, the S&P 500 has historically yielded an annual gain of between 7% and 13% since 1927.
So, the bottom line is that earnings matter for the stock market, but not necessarily in the way that we would traditionally expect. It’s important to remember that the stock market is a forward-looking machine, with investors constantly discounting future expectations. With help from this indicator, we can better understand the relationship between earnings and the stock market.
This is intended for informational purposes only and should not be used as the primary basis for an investment decision. Consult an advisor for your personal situation.
Indices mentioned are unmanaged, do not incur fees, and cannot be invested into directly.
Past performance does not guarantee future results.