When it comes to generating income in retirement, an investor has two primary choices: stocks and bonds.
A bond is straightforward; the income comes from the bond’s yield. On the other hand, stocks throw off dividends, which have the potential to be lucrative but are also riskier because they sometimes get cut or suspended when times are tough.
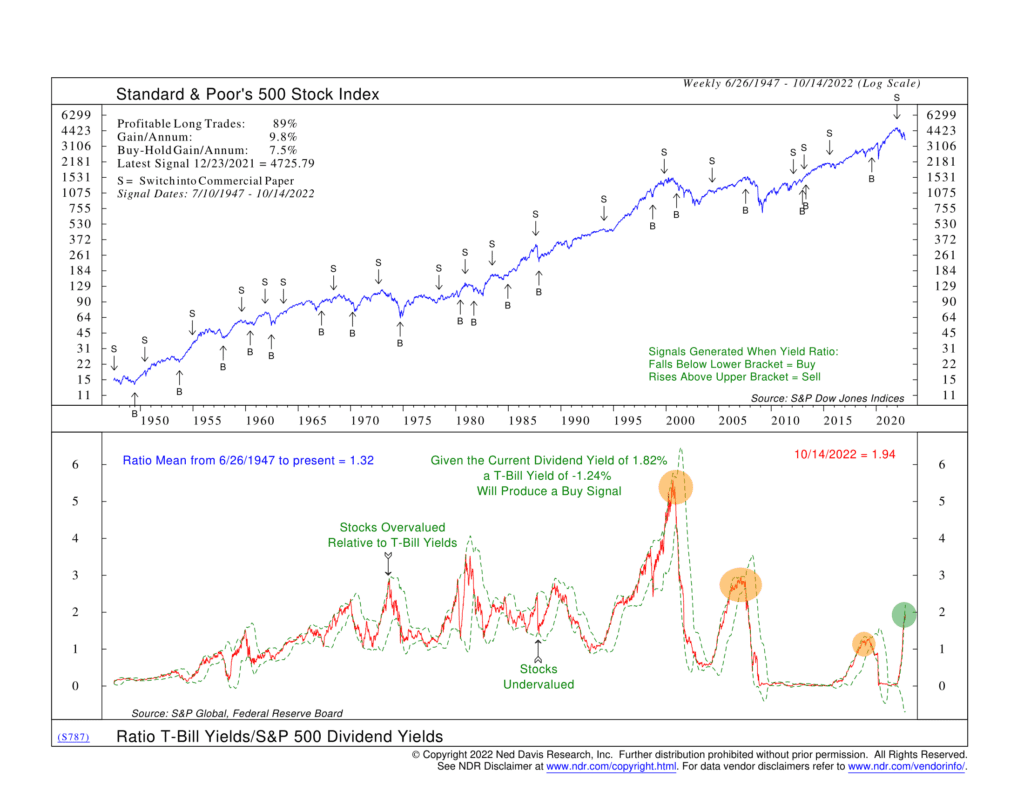
To measure the relative value of stocks versus bonds, we look at the ratio of the yields between the two assets. In the indicator above, we do this specifically by taking the ratio of three-month Treasury bill yields to S&P 500 dividend yields. This is the red line at the bottom of the chart.
The data go back to 1947. Historically, the indicator finds that when the ratio of T-bill yields to stock dividend yields falls below the lower parameter (green dashed line, representing roughly two standard deviations below the mean), it’s a sign that stocks are a better value relative to bonds. And conversely, when the ratio climbs above the upper parameter, it’s a sign that bonds are a better value than stocks.
The chart reveals that large spikes in the ratio have typically occurred before big stock market sell-offs. The downturns in the early 2000s, 2008, and 2020 all saw high T-bill yields relative to stock dividend yields just prior to the crashes. But then, as investors piled into the safety of short-term government bonds, T-bill prices surged (and yields fell), resulting in a sharp downturn in the ratio. At that point, stocks looked like a better bargain, and the ratio bottomed out.
What are we seeing this year? Well, once again, the ratio has spiked as T-bill yields have surged relative to stock dividend yields. The indicator has been bearish since December 2021, when the ratio first climbed above the upper bearish parameter.
There is a problem, though. Unlike many past selloffs, T-bill yields remain pretty high relative to stock dividend yields, despite the S&P 500 being down 20-25%. This is because the Fed is aggressively raising rates to stem inflation.
The takeaway? The stock market will likely have a more challenging time finding a bottom if short-term bond yields remain a viable alternative to stock dividend yields. The current T-bill to stock dividend yield is about 1.94, meaning investors can get nearly double the yield out of a safe short-term U.S. government bond as they can with the S&P 500’s riskier dividend yield. We would like to see the ratio roll over, and the indicator trigger a buy signal before we can say stocks are the better source of investment income.
This is intended for informational purposes only and should not be used as the primary basis for an investment decision. Consult an advisor for your personal situation.
Indices mentioned are unmanaged, do not incur fees, and cannot be invested into directly.
Past performance does not guarantee future results.