For this week’s indicator, we look at the relative performance of stocks versus bonds. These are the two financial assets that people are probably most familiar with. And if you’re saving for retirement, you likely have most of your savings invested in a mix between the two.
People generally do this because, historically, when stocks have done poorly, bonds have performed better, and vice versa. Interestingly, when we take it a step further, we find that the relative performance between stocks and bonds is mean-reverting. By this, we mean that if stocks have outperformed bonds by an extreme amount over the past year, then bonds will start to do better, and stocks will do less well until the relative performance between the two falls back to its historical average. As they say, trees don’t grow to the sky.
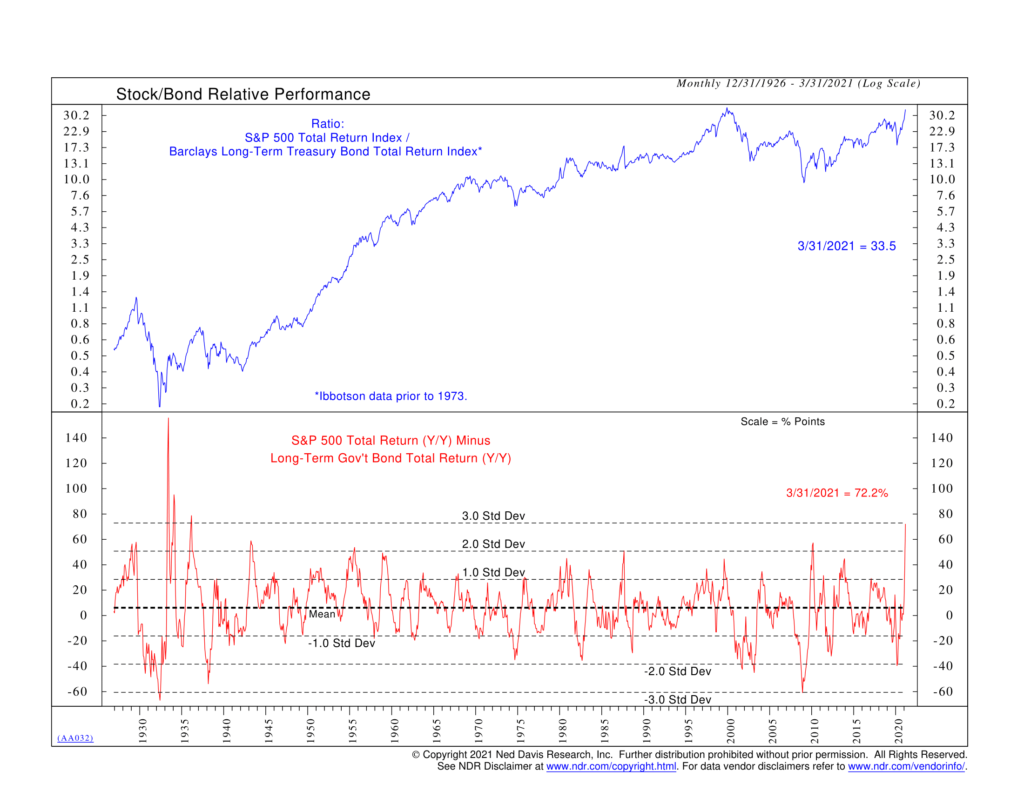
Visually, we can see this dynamic play out on the chart above. The top clip plots the ratio of the S&P 500 Total Return Stock Index to the Barclays Long-Term Total Return Bond Index. Because this is a ratio, it means that a rising line indicates stocks are outperforming bonds, while a falling line means bonds are outperforming stocks. The bottom clip of the chart plots the difference between the 12-month percentage return of stocks and the 12-month percentage return of bonds, using those same S&P 500 and Barclays return data.
But here’s where it gets interesting. Dashed lines are also plotted indicating the historical mean (average) of the stock/bond return spread, as well as lines indicating one, two, and three standard deviations above and below the mean. This is useful because the more standard deviations away from the historical mean the current reading is, the more likely it becomes that we will see the trend reverse back to the average.
Looking at the latest reading, we see that stocks have outperformed bonds over the past 12 months by so much that the ratio is now three standard deviations above the historical mean. This is the highest level since the 1930s! Not only have stocks had a monster run over the past 12 months, but bonds also just finished their worst quarter of performance since the 1980s.
Our indicator suggests a high likelihood that bonds will start to claw their way back against stocks in the coming years. This doesn’t mean that stocks must necessarily fall, though. Both stocks and bonds can be rising at the same time and still see their relative performance line fall back to average if bonds are rising at a faster pace than stocks. That would probably be the preferred scenario for most investors.
This is intended for informational purposes only and should not be used as the primary basis for an investment decision. Consult an advisor for your personal situation.
Indices mentioned are unmanaged, do not incur fees, and cannot be invested into directly.
Past performance does not guarantee future results.