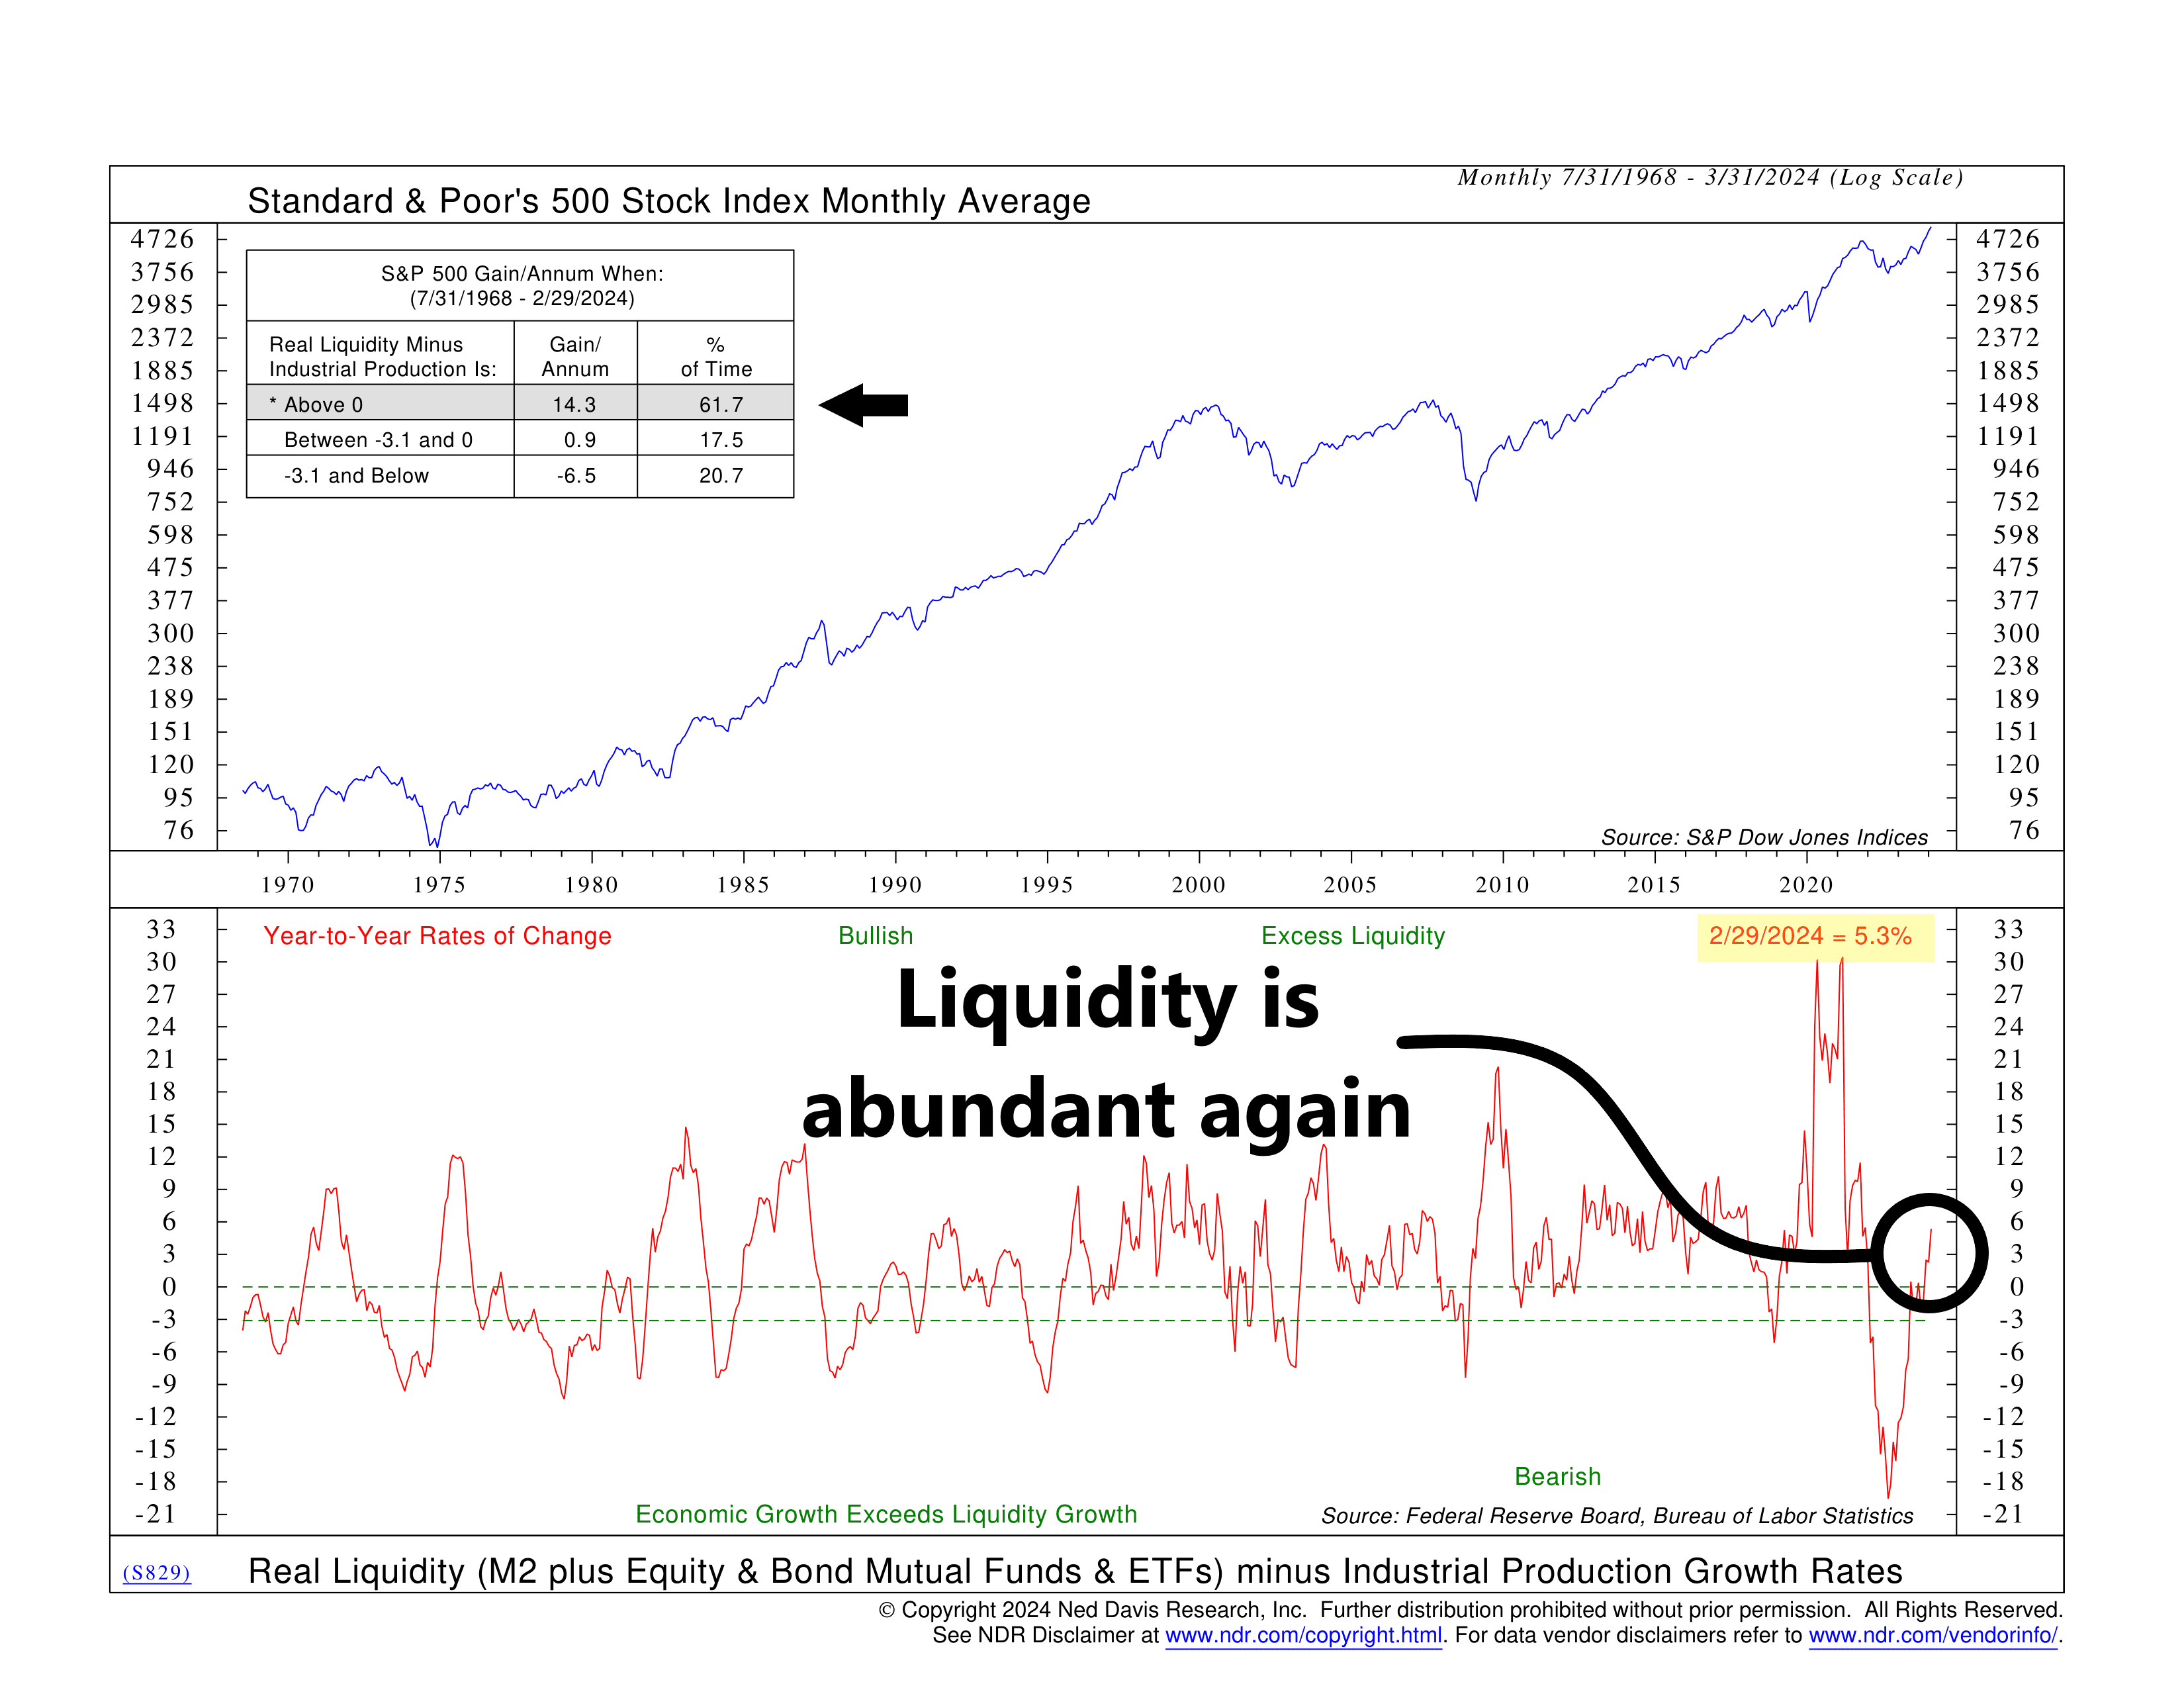
The famous investor Stanley Druckenmiller once quipped that what really moves the market is liquidity, or the availability of cash, rather than earnings or other traditional factors. Whether that is true or not could be debated, but it does make sense that if money is everywhere, it has to go somewhere.
That’s the logic behind this week’s featured indicator, shown above. We call it the Real Liquidity indicator because it measures how much cash is flowing through the financial system above and beyond what is needed for economic growth. In other words, it measures excess liquidity.
To calculate it, we look at the yearly growth rate in industrial production and subtract that from the 12-month change in real liquidity, which includes the M2 money supply plus equity and bond funds. Why do we do this? Because industrial production represents the economy (excluding inflation), so removing it from the change in real liquidity gives us a clearer picture of excess liquidity.
This is important because we’ve found that when excess liquidity growth is greater than zero, it has corresponded with S&P 500 returns of more than 14% per year, on average, with data going back to 1968. On the other hand, when the change in excess liquidity turns negative, the market’s returns tend to flatten or even decline at times.
The good news? After record-low levels of excess liquidity in 2022, this indicator has fully reversed course and is back into positive territory. The latest monthly reading showed that real liquidity growth is 5.3% greater than industrial production growth, putting it into the indicator’s bullish zone for stock prices.
The bottom line? According to this indicator, not only is there enough money flowing through the economy to cover economic growth and inflation but there is also enough left over to fuel further stock market gains.
This is intended for informational purposes only and should not be used as the primary basis for an investment decision. Consult an advisor for your personal situation.
Indices mentioned are unmanaged, do not incur fees, and cannot be invested into directly.
Past performance does not guarantee future results.
The S&P 500 Index, or Standard & Poor’s 500 Index, is a market-capitalization-weighted index of 500 leading publicly traded companies in the U.S
