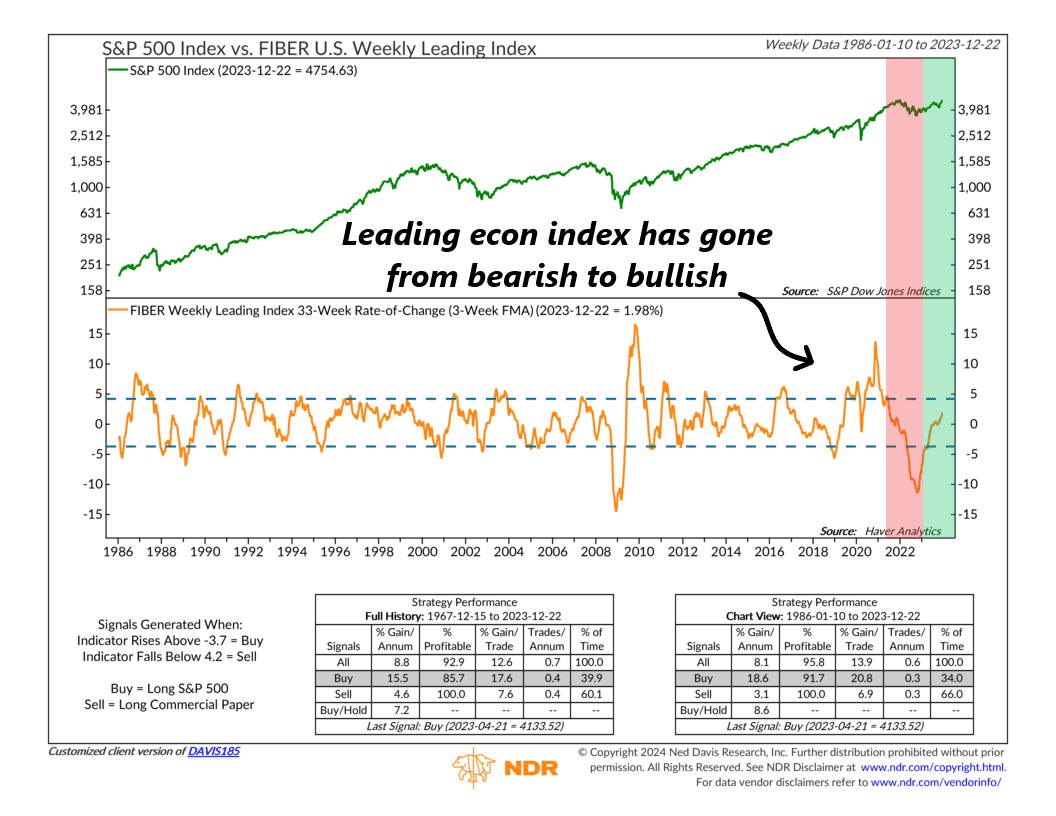
The FIBER U.S. Weekly Leading Index is a tool economists and investors use to measure economic growth. It’s called a “leading index” because it tends to lead the economic cycle by several months. Since it reveals the direction in which the economy is likely headed, the FIBER Weekly Leading Index can also provide insights into where the stock market might be going.
To get the indicator, we take the 33-week rate-of-change of the FIBER Weekly Leading Index and smooth that out by about 3 weeks. This so-called “smoothed momentum” measure can then be used to anticipate changes and reversals in the leading index.
For example, when the indicator (orange line, bottom clip) rises above and then falls below the top bracket (4.2 level), it generates a sell signal for the S&P 500 stock index (green line, top clip). This happened most recently near the end of 2021, signaling that the economy might slow down significantly the following year. And even though a recession never materialized, stocks did drop considerably in 2022.
The good news, however, is that the indicator bottomed and turned higher in October 2022, which also happened to be when the S&P 500 bottomed out. And then, early in 2023, it rose above the lower bracket on the chart (-3.7 level), triggering a buy signal for stocks. It has continued to move higher ever since and is currently in positive-momentum territory.
This gives us at least some degree of confidence that the economy will likely hold up well to the benefit of stocks as we head into 2024.
This is intended for informational purposes only and should not be used as the primary basis for an investment decision. Consult an advisor for your personal situation.
Indices mentioned are unmanaged, do not incur fees, and cannot be invested into directly.
Past performance does not guarantee future results.
The S&P 500 Index, or Standard & Poor’s 500 Index, is a market-capitalization-weighted index of 500 leading publicly traded companies in the U.S.
