This week’s indicator is sort of like a tornado siren for the stock market. It produces an alert when market conditions get risky. But unlike a tornado siren, it also gives an alert when conditions get less risky.
We call it the Long Exposure Risk Index—or LEXI, for short. As a leading indicator, it’s designed to warn us ahead of time of increasing or decreasing risk conditions in the stock market, based on investor psychology.
It’s a combination of 36 smaller indicators—mostly sentiment and overbought/oversold indicators, adjusted for monetary conditions. The overall reading gets scaled from 0% to 100%, with higher readings indicating more bullish conditions for the stock market.
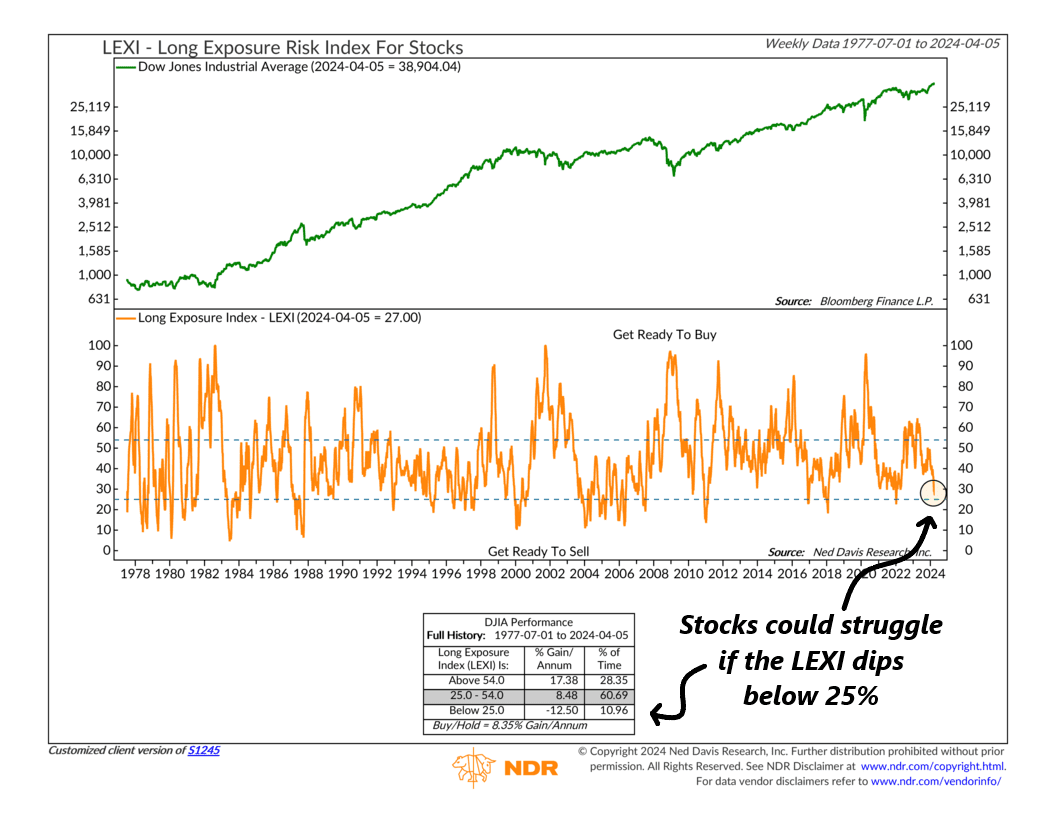
Here’s how it works: On the top clip of the chart above, we have the performance of the Dow Jones Industrial Average going back to 1977. This is our stock market index. On the bottom, in orange, we have the overall percentage reading for the Long Exposure Index (LEXI).
When the LEXI gets above the top dashed line (higher than 54%), a “low market risk” alert is generated. This basically means that, based on investor psychology, the market environment is favorable for stock returns. And sure enough, the performance box near the bottom shows that the stock market has produced an average annualized return of more than 17% when the LEXI is this high.
By contrast, when the LEXI dips below 25% (the lower dashed line), a “high market risk” alert is generated. This is a sign that market conditions are getting too risky, based on historical standards. And when the LEXI has gotten this low historically, the Dow’s average return drops to -12.5%. Yikes!
What’s the LEXI saying now? Well, it’s been deteriorating pretty rapidly recently after having been in bullish territory for the majority of the stock market rally. That latest weekly reading was just 27%. While still technically neutral, it’s edging dangerously close to falling below the lower dashed line and triggering a “high market risk” alert. This could potentially lead to some challenges for stocks if that scenario plays out.
So, the bottom line is that due to the recent deterioration in this indicator, history would probably advise against taking unnecessary risks in the market at this time.
This is intended for informational purposes only and should not be used as the primary basis for an investment decision. Consult an advisor for your personal situation.
Indices mentioned are unmanaged, do not incur fees, and cannot be invested into directly.
Past performance does not guarantee future results.
The Dow Jones Industrial Average (DJIA) is a price-weighted index composed of 30 widely traded blue-chip U.S. common stocks.