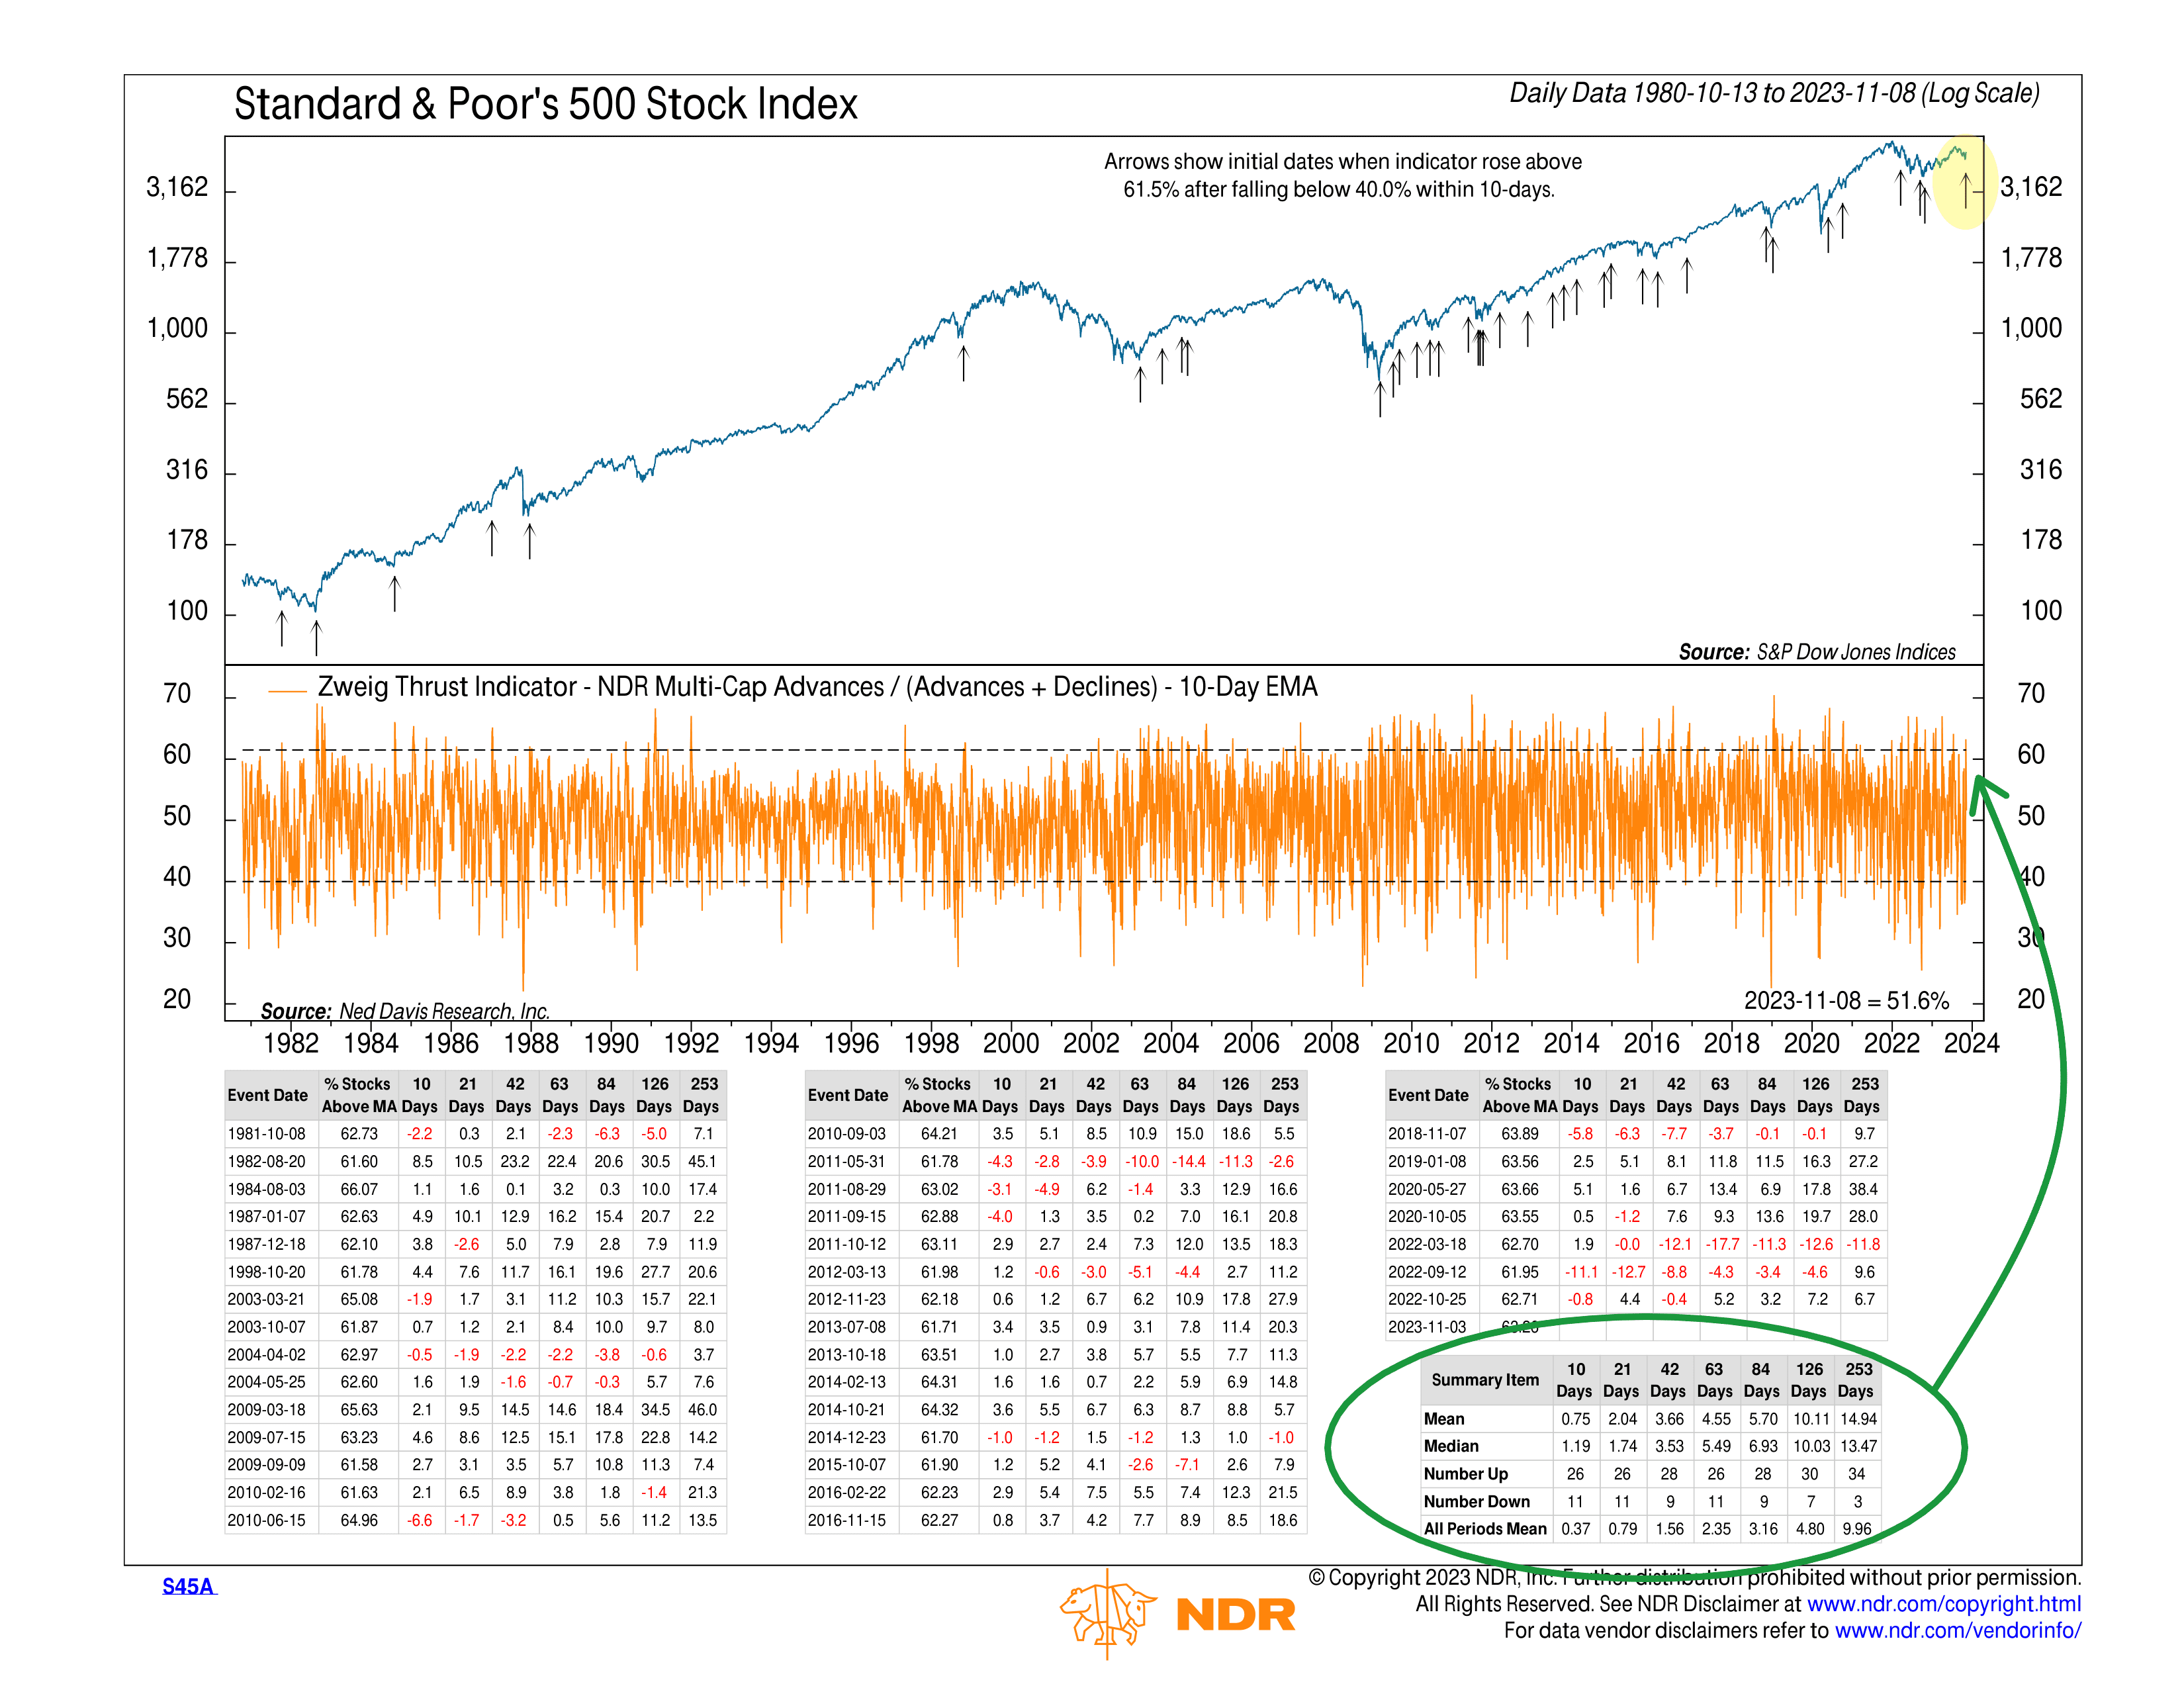
This week’s featured indicator is the Zweig Thrust Indicator, named after the savvy financial analyst and investor Martin Zweig. This so-called market breadth indicator is all about figuring out how strong a market rally is.
The indicator (shown as the orange line on the chart) looks at the percentage of stocks on the rise compared to the total number traded, using a 10-day exponential moving average. When this indicator goes above 61.5% after taking a dip below 40% in the past ten trading days, it flashes a “buy” signal.
Translation: it gets positive when a bunch of stocks join a rally right after the market takes a hit.
Last week was a classic example. The S&P 500 Index was down around 10% from its yearly high on October 27th. But within five trading days, the decline was cut in half. That snapback was so strong that it triggered a buy signal.
History says this is a good sign. On average, a year after a Zweig thrust signal, the S&P 500 returns about 15%. Looking at the charts, we can see that since the 1980s, 34 signals ended with gains, and only three were losses.
But here’s the plot twist. Over shorter periods, the results are more erratic. Recent signals since 2018 have been a mixed bag, with some still showing losses half a year to even a year later. This makes the indicator a little less reliable as a stand-alone metric.
So, the bottom line is that the Zweig Thrust Indicator is a powerful tool that can help us spot when the market might be making a potential U-turn. It’s all about looking at the big picture—how many stocks are joining the party? Over the long haul, it has a pretty solid track record. But, as with any indicator, it’s even better when teamed up with other indicators and a pile of evidence.
This is intended for informational purposes only and should not be used as the primary basis for an investment decision. Consult an advisor for your personal situation.
Indices mentioned are unmanaged, do not incur fees, and cannot be invested into directly.
Past performance does not guarantee future results.
The S&P 500 Index, or Standard & Poor’s 500 Index, is a market-capitalization-weighted index of 500 leading publicly traded companies in the U.S.
