For this week’s indicator, we focus on nonfarm unit labor costs. The biggest expense for most businesses is labor. And one way to measure the cost of labor is by looking at unit labor costs, or how much a firm pays its workers to produce one unit of output. In other words, it’s a measure of how efficient a business is at using labor to produce output.
We calculate unit labor costs by taking the total compensation paid to workers and dividing it by total output. Alternatively, we can take hourly compensation divided by output per hour to get unit labor costs. Stated this way, increases in hourly compensation raises unit labor costs, while increases in output per hour (i.e., labor productivity) reduces them.
For example, let’s say you run a business producing widgets. You employ one worker who can make 10 widgets an hour for $10 an hour. That means it costs your business $1 to generate one widget. Your unit labor cost (or cost per unit of output) is $1.
However, let’s say you want to expand your business, so you hire another worker to produce an additional 10 widgets per hour. But because labor is scarce, you have to pay them $11 an hour to entice them to work for you. In this new scenario, your workers produce 20 widgets per hour for a total cost of $21 an hour. If we take $21/hour divided by 20 widgets/hour, we get a new unit labor cost of $1.05. That’s a 5% increase from before.
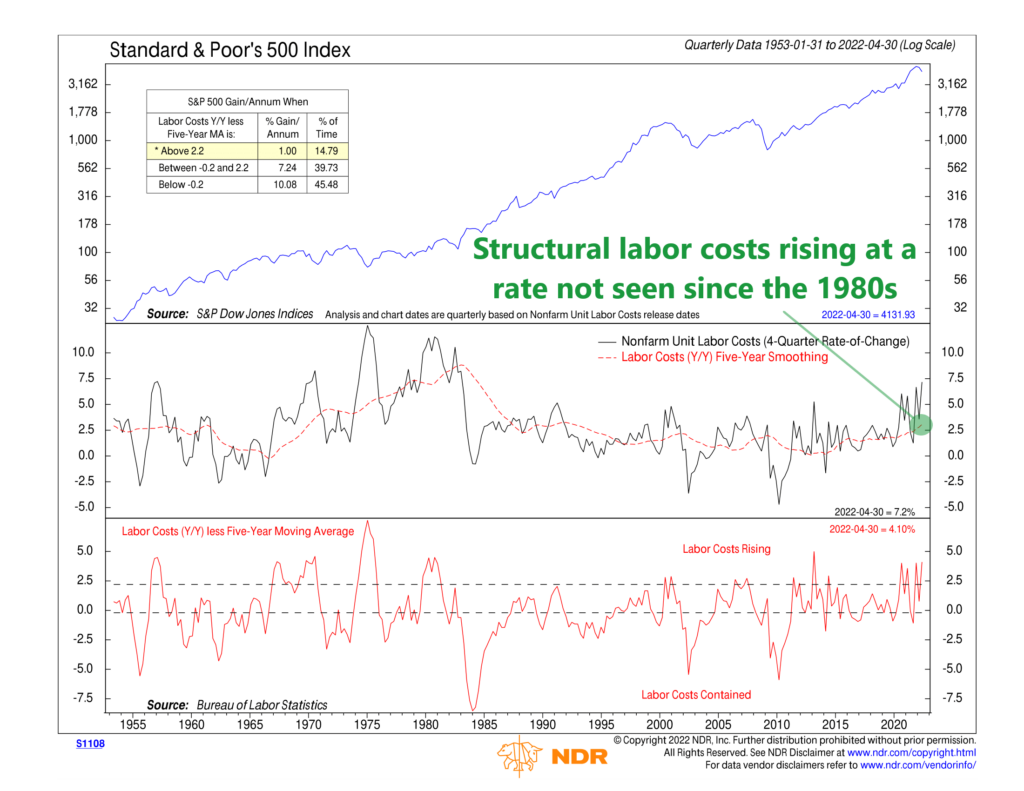
This is the dynamic that the indicator above measures, but for the whole economy. The black line in the middle clip represents the year-over-year change in nonfarm unit labor costs, and the red dashed line is the 5-year average of the year-over-year change. The bottom clip of the chart then measures how far away the current year-over-year change in unit labor costs is from the 5-year average.
Since increasing unit labor costs reduce margins and thus corporate profits, we find that a year-over-year change in unit labor costs that is more than 2.2 percentage points higher than its 5-year average has coincided with poor stock market returns. In contrast, the majority of the stock market’s returns have come when the year-over-year change is less than 2.2 percentage points higher than the 5-year average—and even higher returns come when the spread is negative (meaning the year-over-year change is below the 5-year average).
One important thing that I want to highlight is the 5-year average of annual labor costs increases (the red dashed line in the middle clip). This can be thought of as a structural measure of labor costs versus the noisier year-to-year changes. This has been climbing since the pandemic and is now over 3%. You’d have to go back to the 1980s to find a time when structural labor costs were rising by this much. This will be important to watch going forward as inflation will be much harder to control if we see these structural unit wage increases become entrenched in the economy.
This is intended for informational purposes only and should not be used as the primary basis for an investment decision. Consult an advisor for your personal situation.
Indices mentioned are unmanaged, do not incur fees, and cannot be invested into directly.
Past performance does not guarantee future results.