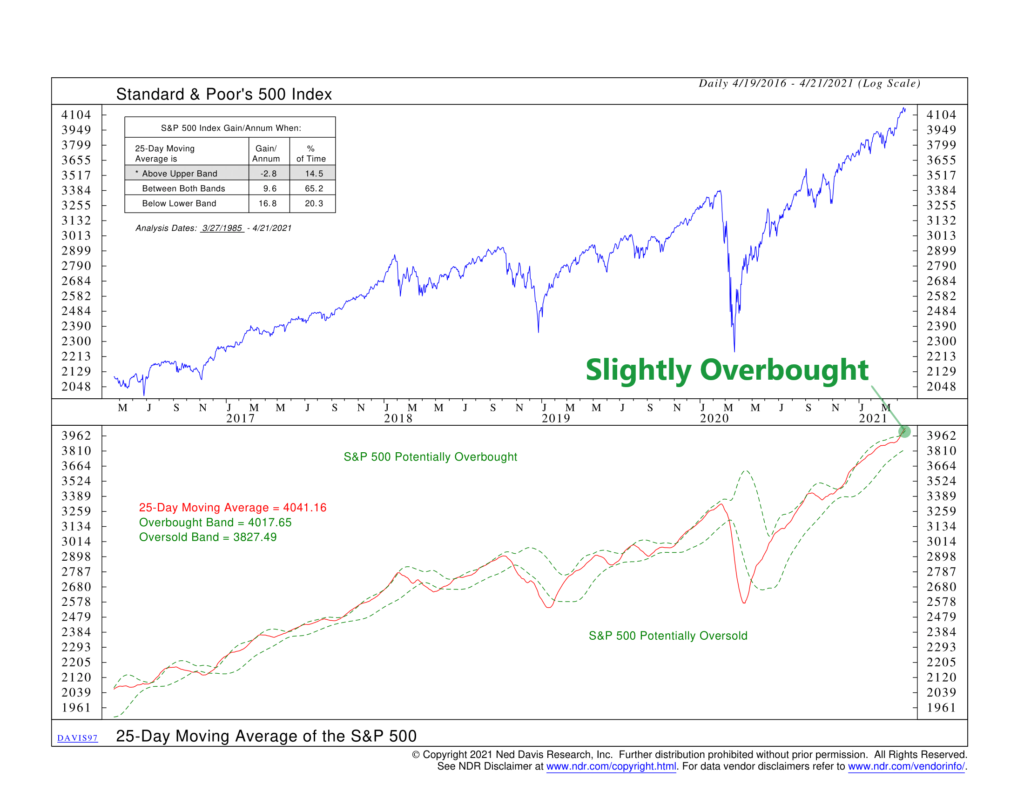
This week we focus on a concept regularly used in technical analysis known as “overbought/oversold.” The idea is fairly straightforward: Look at the recent price movement of a stock or stock index and determine if it is currently at an extreme—either too high or too low. Many times, if an extreme has been reached, prices are more likely to reverse and return to a more normal trading range.
There are various ways to measure this, but in our chart above, we use a simple moving average metric with standard deviation bands to determine overbought and oversold levels.
Here’s how it works. We plot the S&P 500 stock market index in the top clip (blue line), and in the bottom clip, we plot the 25-day moving average of that same S&P 500 index (red line). We use a 25-day moving average because it smooths out the day-to-day fluctuations of the stock index by measuring the average price over the past month. This presents a clearer picture of the recent trend in stock prices.
The green dashed lines that move along with the 25-day moving average represent one standard deviation above and below that average. Standard deviation is a statistical measure for how much a price series varies from its average. As a rough approximation, we would expect the stock index to trade between those standard deviation bands about 68% of the time. Therefore, if the price goes above or below those lines, it’s a sign that it has reached an extreme point in its historical distribution, and it’s less likely it will continue to trade at such excessive levels.
Indeed, the performance box on the chart reveals that when prices have climbed above the upper standard deviation band in the past, it has resulted in negative returns for the S&P 500. This generally happens about 15% of the time. But when prices fall below the lower standard deviation band, returns are stellar—about 17% per year, on average. This happens at a slightly more frequent rate, about 20% of the time.
If we add those up, it means that prices spend about 35% of the time outside of the standard deviation bands. The other 65% of the time, they stay within those bands. This is pretty darn close to what we would expect statistically, making this indicator another valuable tool to use in our risk management process.
This is intended for informational purposes only and should not be used as the primary basis for an investment decision. Consult an advisor for your personal situation.
Indices mentioned are unmanaged, do not incur fees, and cannot be invested into directly.
Past performance does not guarantee future results.
