Is a recession coming? While a definitive yes-or-no answer to a question like that is virtually impossible, we can get somewhat close by using a model that assigns a probability to the outcome—called a Recession Probability Model.
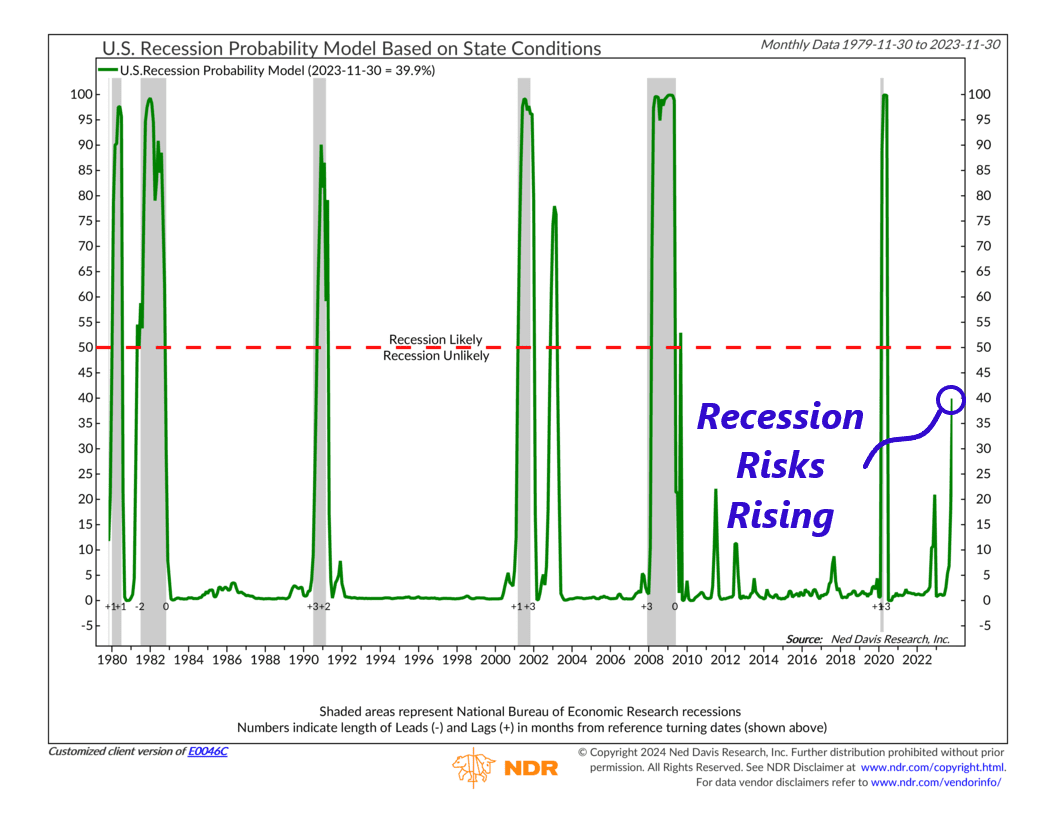
The main ingredients for the model are state coincident indexes produced by the Federal Reserve Bank of Philadelphia. These indexes combine factors like nonfarm employment, manufacturing hours worked, the unemployment rate, and real wages and salaries from U.S. states into a 3-month diffusion index. This diffusion index is then fed through a fancy statistical model (called a logit regression) to get the indicator’s output, shown as the green line on the chart above.
The line is scaled from 0% to 100%, with a higher value indicating an increased probability of a U.S. recession. As highlighted on the chart, once the likelihood gets above 50% (the red dashed line), it means a recession is likely. Indeed, the model has a track record of identifying NBER-defined recessions (grey-shaded areas) within about two months of the actual start date.
So, where do we stand now? The latest update in December puts the probability at around 40%, a notable increase from the previous month’s reading, which was below 20%.
This significant jump in just one month has caught our attention.
In response, we’ll be closely monitoring this indicator going forward. If the probability jumps above 50%, it will signal a substantially higher risk of a recession in the coming months. The stock market dismissed recession concerns last year, but a further decline in actual state economic conditions this year could alter the situation—and this indicator will help us be ready for that possibility.
This is intended for informational purposes only and should not be used as the primary basis for an investment decision. Consult an advisor for your personal situation.
Indices mentioned are unmanaged, do not incur fees, and cannot be invested into directly.
Past performance does not guarantee future results.