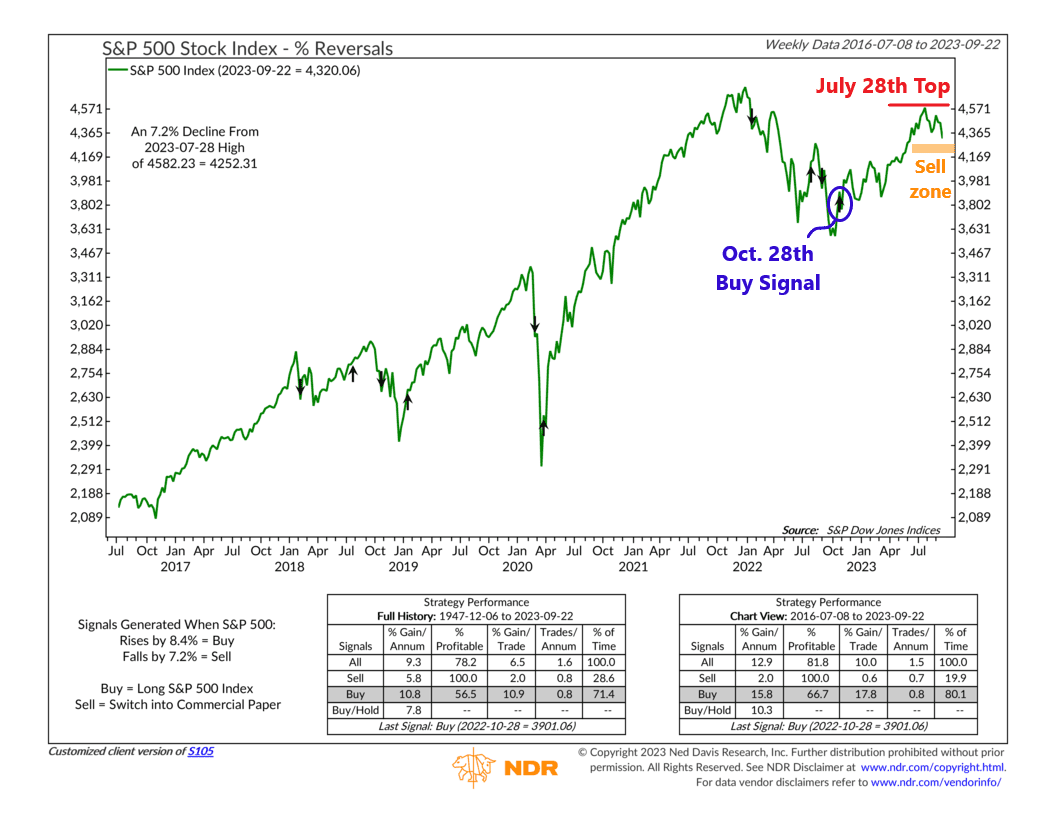
July 28th, 2023. That was the day the S&P 500 index reached its highest level of the year (so far).
Since then, the market has tumbled. As of this writing, the S&P 500 index is down roughly 7% from its summer high.
After two months of a down market, it’s no surprise that we’ve seen significant deterioration in our stock market indicators. Participation has been weak. Volume and flow indicators have been even weaker. Momentum is also starting to wane. As for the trend indicators, they’ve held up well so far (not surprising, as they tend to be the last to go). But as our featured indicator this week will show, that’s also about to change.
The goal of the indicator—which we call Percentage Reversals—is to measure when the stock market is reversing course. The rules of the indicator are simple: when the S&P 500 stock index rises by 8.4% or more on a weekly closing basis, a buy signal is generated; when the S&P 500 falls by 7.2% or more on a weekly closing basis, a sell signal is generated. That’s it. Pretty straightforward. But it works.
That latest reading—a buy signal—came on October 28th, 2022, right around when the market bottomed out for the cycle. That was a timely signal, as the market rose double-digits after that buy signal. However, the next key level is 7.2% below the July 28th, 2023 high (about 4252 on the S&P 500 Index). If the market closes at or below that level on Friday, it will officially trigger a sell signal.
If that happens, does it mean the market is doomed? Not necessarily. Historically, gains have still been positive for the S&P 500 Index after sell signals, but they are much weaker—and below average.
Mostly, a sell signal will tell us that the risk of a trend reversal is rising. As usual, we’ll need to consult our other trend indicators to determine if the weight of the evidence has shifted. The indicators remain primarily positive for now, but that could change in the coming weeks. The longer the downturn occurs, the more damage it will do to the market’s overall trend, so this will be an important area of the market to keep an eye on.
This is intended for informational purposes only and should not be used as the primary basis for an investment decision. Consult an advisor for your personal situation.
Indices mentioned are unmanaged, do not incur fees, and cannot be invested into directly.
Past performance does not guarantee future results.
The S&P 500 Index, or Standard & Poor’s 500 Index, is a market-capitalization-weighted index of 500 leading publicly traded companies in the U.S.