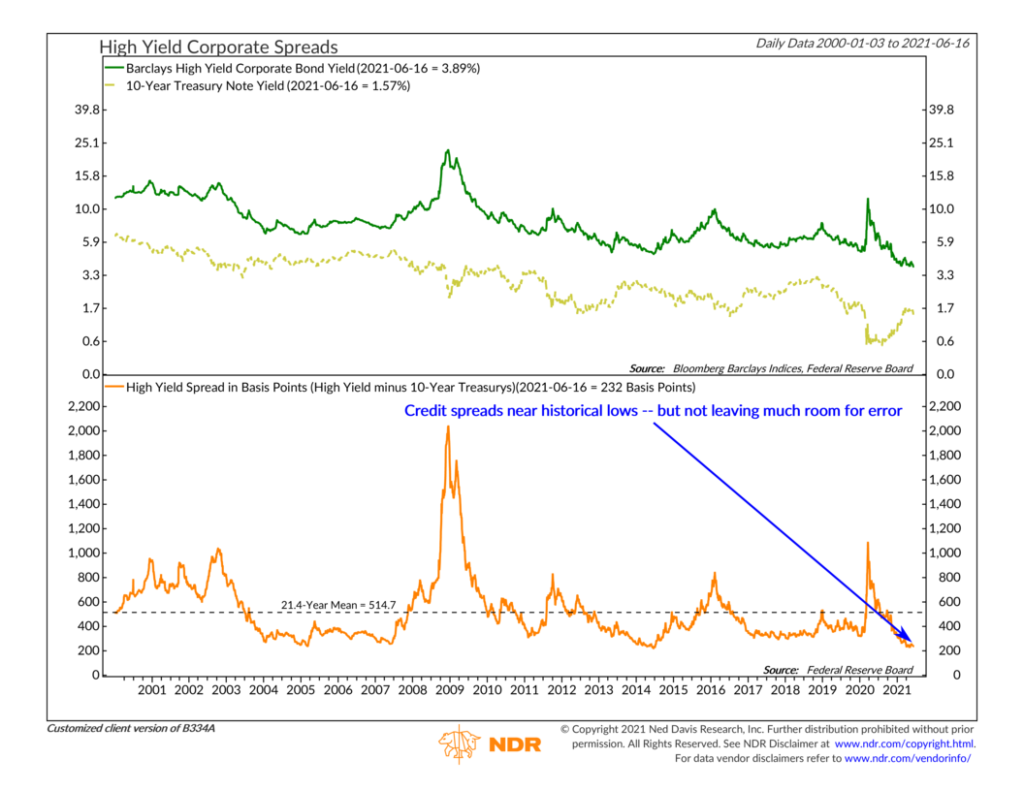
This week we look at what we call a “credit spread” indicator. A credit spread indicator gets its name from the fact that it measures the difference between a safe asset, like a U.S. Treasury bond, and a debt security of the same maturity but with lower credit quality.
For example, when you invest in something like a 10-year government bond issued by the U.S. Treasury, you’re mainly exposed to duration risk—the risk associated with tying up your money for an extended period of time at a fixed interest rate. If the prevailing market interest rates change during the life of your bond, it will potentially affect the value of your investment. But since the U.S. government issued the bond, the risk of default remains zero.
However, when you buy the bond of a publicly-traded company with a lower credit rating, you’re not only taking on duration risk; you’re also taking on a large amount of credit risk—the risk that the company will not pay you back what you’re owed. By taking the difference between the yield on your risky corporate bond and a safe government bond, we can understand how much the market is worried about credit risk.
That’s what our high yield credit spread indicator above does. In the top clip of the chart, the green line shows the yield on the Barclays High Yield Corporate Bond Index over time. Essentially, this illustrates how much it costs a junk-rated company to borrow in the corporate bond market. As you can see, the yield moves around quite a bit, but it is always higher than the safe (no credit risk) 10-year Treasury note yield in the dashed gold line below it. And to get a better sense of how much the credit spread risk is changing over time, the orange line in the bottom clip simply calculates the difference between the two yields.
Historically, the average difference between the two spreads has been about 515 basis points or 5.15 percentage points. However, during times of crisis, the spread has gotten “blown out.” For example, during the 2008 Financial Crisis, the spread rose as high as 2,000 basis points (20 percentage points), and during the most recent crisis, spreads rose to more than 1,000 basis points (10 percentage points).
That’s why it’s a valuable indicator for gauging stock market risk. If investors are nervous about companies defaulting on their debt, they will bid up the price of Treasuries (sending their yields lower) and bid down the price of corporate debt (sending their yields higher). The result is a higher credit spread. But, of course, this type of environment doesn’t bode well for holders of corporate equity either, so stock prices tend to fall as well.
We find that the best environment for stock returns is when the high-yield credit spread indicator has peaked (above the historical average) and started falling relative to where it was a month ago. This is a sign that the worst is behind us, and stock returns tend to do well coming out of the bottom of a crisis.
On the other hand, when the high-yield credit spread gets really low (below the historical average) but begins to rise relative to where it was a month ago, it’s a sign that trouble could be brewing. High-yield bonds tend to sell off relative to Treasuries at the start of a crisis, warning us that stocks could be in for a bumpy ride in the months ahead.
Currently, the high-yield credit spread indicator is at historically low levels. Even as the yield on 10-year U.S. Treasuries has risen this year, the yields on high-yield corporate bonds continue to plumb record lows.
The good news is that the spread is historically low, meaning the market isn’t anticipating much credit risk. But the bad news is that the spread is indeed historically low and the market isn’t expecting much credit risk. That’s not leaving much room for error.
This is intended for informational purposes only and should not be used as the primary basis for an investment decision. Consult an advisor for your personal situation.
Indices mentioned are unmanaged, do not incur fees, and cannot be invested into directly.
Past performance does not guarantee future results.
