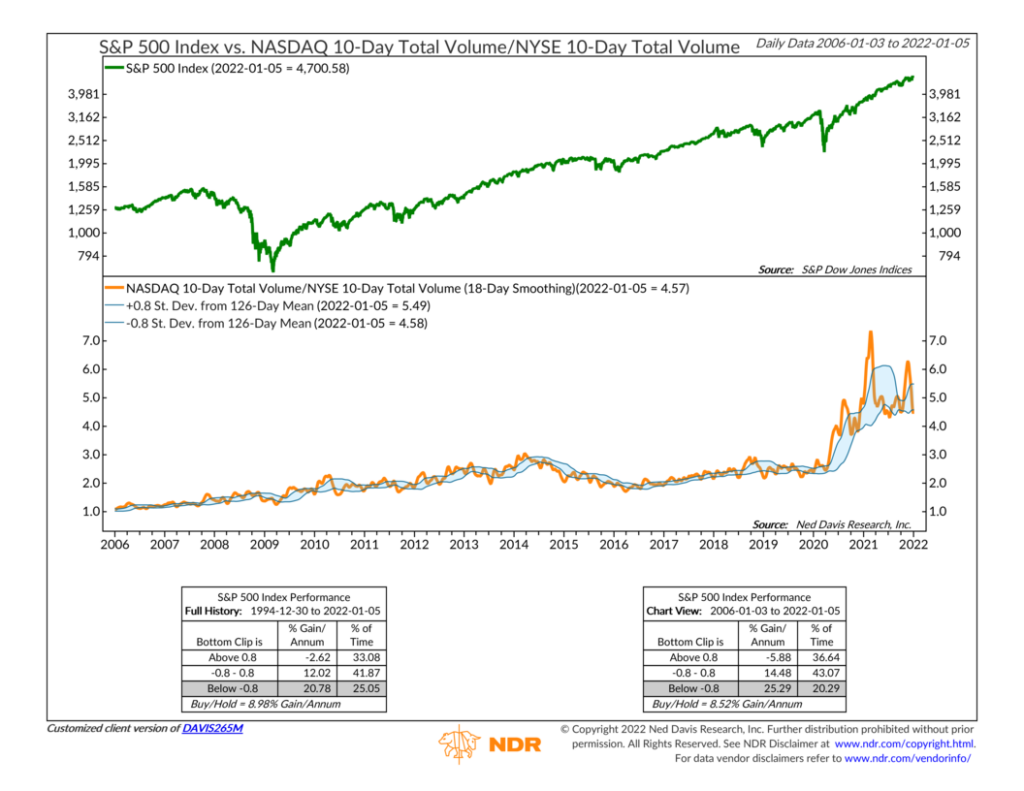
I like to think of this week’s featured indicator as a tug of war between the two major stock exchanges in North America: the Nasdaq and the New York Stock Exchange (NYSE). The relative differences between these two exchanges create a unique opportunity—which our indicator exploits—to measure overall sentiment in the marketplace.
The Nasdaq exchange was the first global electronic marketplace for trading stocks, and it is largely known for cutting-edge technology and innovation. Due to this, and the fact that it’s easier to list new shares on the Nasdaq than the NYSE, the stocks that trade on it are generally more growth-oriented, volatile, and more speculative in nature.
In contrast, the NYSE is the oldest American stock exchange, housing blue chip stocks, industrials, and many of the businesses that have been around for generations.
Therefore, as a rule of thumb, we will say that activity on the Nasdaq can be viewed as more speculative, whereas activity on the NYSE is less risky.
To set up our tug-of-war scenario, the indicator takes the 10-day total volume of stocks traded on the Nasdaq and divides it by the 10-day total volume of stocks traded on the NYSE. This is the orange line in the bottom clip of the chart.
The way to think about this is that when the line is rising, it means more trading activity is taking place on the more speculative Nasdaq exchange relative to the less risky NYSE exchange. In other words, the Nasdaq is winning the tug of war. But when the line is falling, the reverse is true, and the NYSE is winning.
Since this is a sentiment indicator, it looks for extremes in optimism and pessimism to signal when things have gotten overdone, which we then utilize to our advantage by leaning in the opposite direction of the extreme sentiment. To do this, the indicator applies +/- 0.8 standard deviation bands to the Nasdaq/NYSE volume ratio, shown as the blue shaded range overlayed atop the orange line.
When the ratio (orange line) rises above the standard deviation range, it’s a warning of excessive optimism, as more volume is flowing into the more speculative Nasdaq exchange. The S&P 500 stock index, shown as the green line on the top of the chart, tends to have negative annualized returns, on average, when this occurs.
However, as you might have guessed, the S&P 500 does a whole lot better when the Nasdaq/NYSE volume ratio falls below the standard deviation range—a sign that investors are engaging in less speculation. The S&P has returned north of 20% per year, on average, in this scenario.
There’s one interesting thing to note about this indicator. As you can see on the chart, the amount of activity on the Nasdaq exchange skyrocketed relative to the NYSE after the pandemic first struck in 2020. There certainly has been no shortage of speculation in the stock market over the past two years or so. And consequently, the ratio is trading at much higher levels relative to where it’s been in the past.
But, the cool thing about this indicator is that it still works despite this abnormally high ratio level. Because it uses the moving standard deviation range, it adapts to new regimes and uses history over the past 126-day trading days to determine what is considered extreme. This adaptive property makes the indicator a valuable tool in a risk-aware investor’s toolbox.
This is intended for informational purposes only and should not be used as the primary basis for an investment decision. Consult an advisor for your personal situation.
Indices mentioned are unmanaged, do not incur fees, and cannot be invested into directly.
Past performance does not guarantee future results.
