The OFR Financial Stress Index (OFR FSI) is a neat little metric produced by the Office of Financial Research that measures the amount of stress in global financial markets. It combines roughly 33 market variables—from yield spreads to valuation measures—into one series that is positive when stress levels are above average and negative when stress levels are below average.
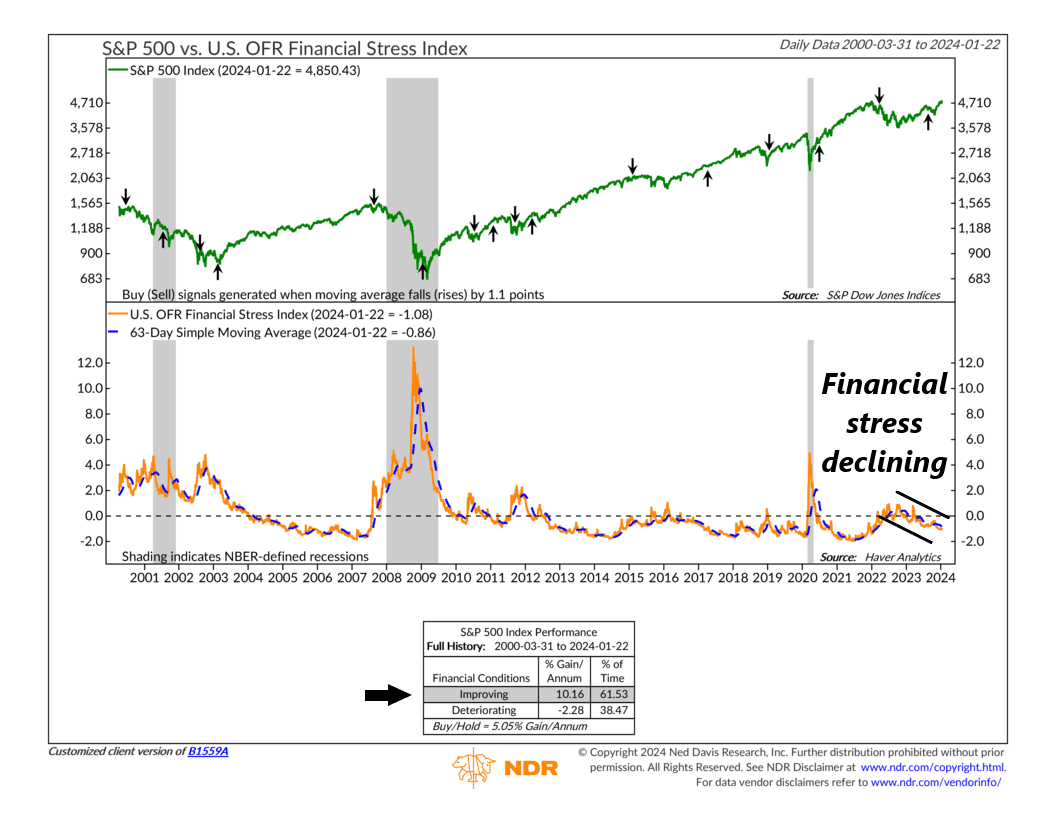
The indicator above shows both the OFR FSI (orange line, bottom clip) and its accompanying 63-day—or 3-month—moving average (blue dashed line, bottom clip). We find that the S&P 500 Index (green line, top clip) does the best when the 3-month moving average has fallen by at least 1.1 points. Indeed, since 2000, the S&P has historically returned more than 10% per year when this is the case. By contrast, when the indicator rises more than 1.1 points from a low, stock returns have been negative, to the tune of about -2.3% per year, on average.
Looking at the chart, you can see where periods of increased financial stress have historically led to subpar stock market returns. The 2008 Financial Crisis and the 2020 Coronavirus Crisis are obvious examples. But this most recent period in 2022 also stands out. The indicator gave a sell signal in March 2022, as the Federal Reserve’s aggressive rate-hiking agenda produced increased financial stress globally.
The good news, however, is that we’re finally seeing some stress relief. The OFR FSI dropped below zero last year, a sign of abating financial stress. It’s currently below its 3-month average, which also fell far enough to trigger a stock market “buy” signal last August.
All this points to signs that financial conditions are currently supportive of risk assets—stocks included.
This is intended for informational purposes only and should not be used as the primary basis for an investment decision. Consult an advisor for your personal situation.
Indices mentioned are unmanaged, do not incur fees, and cannot be invested into directly.
Past performance does not guarantee future results.
The S&P 500 Index, or Standard & Poor’s 500 Index, is a market-capitalization-weighted index of 500 leading publicly traded companies in the U.S.