Over the past few weeks, we’ve spent some time diving into the state of corporate earnings—how they’re holding up, what expectations look like, and whether they’re realistic. This week, we’re taking it a step further by linking those earnings to the broader economic backdrop, using a tried-and-true indicator that connects real-time business activity to earnings growth: the ISM Composite Index.
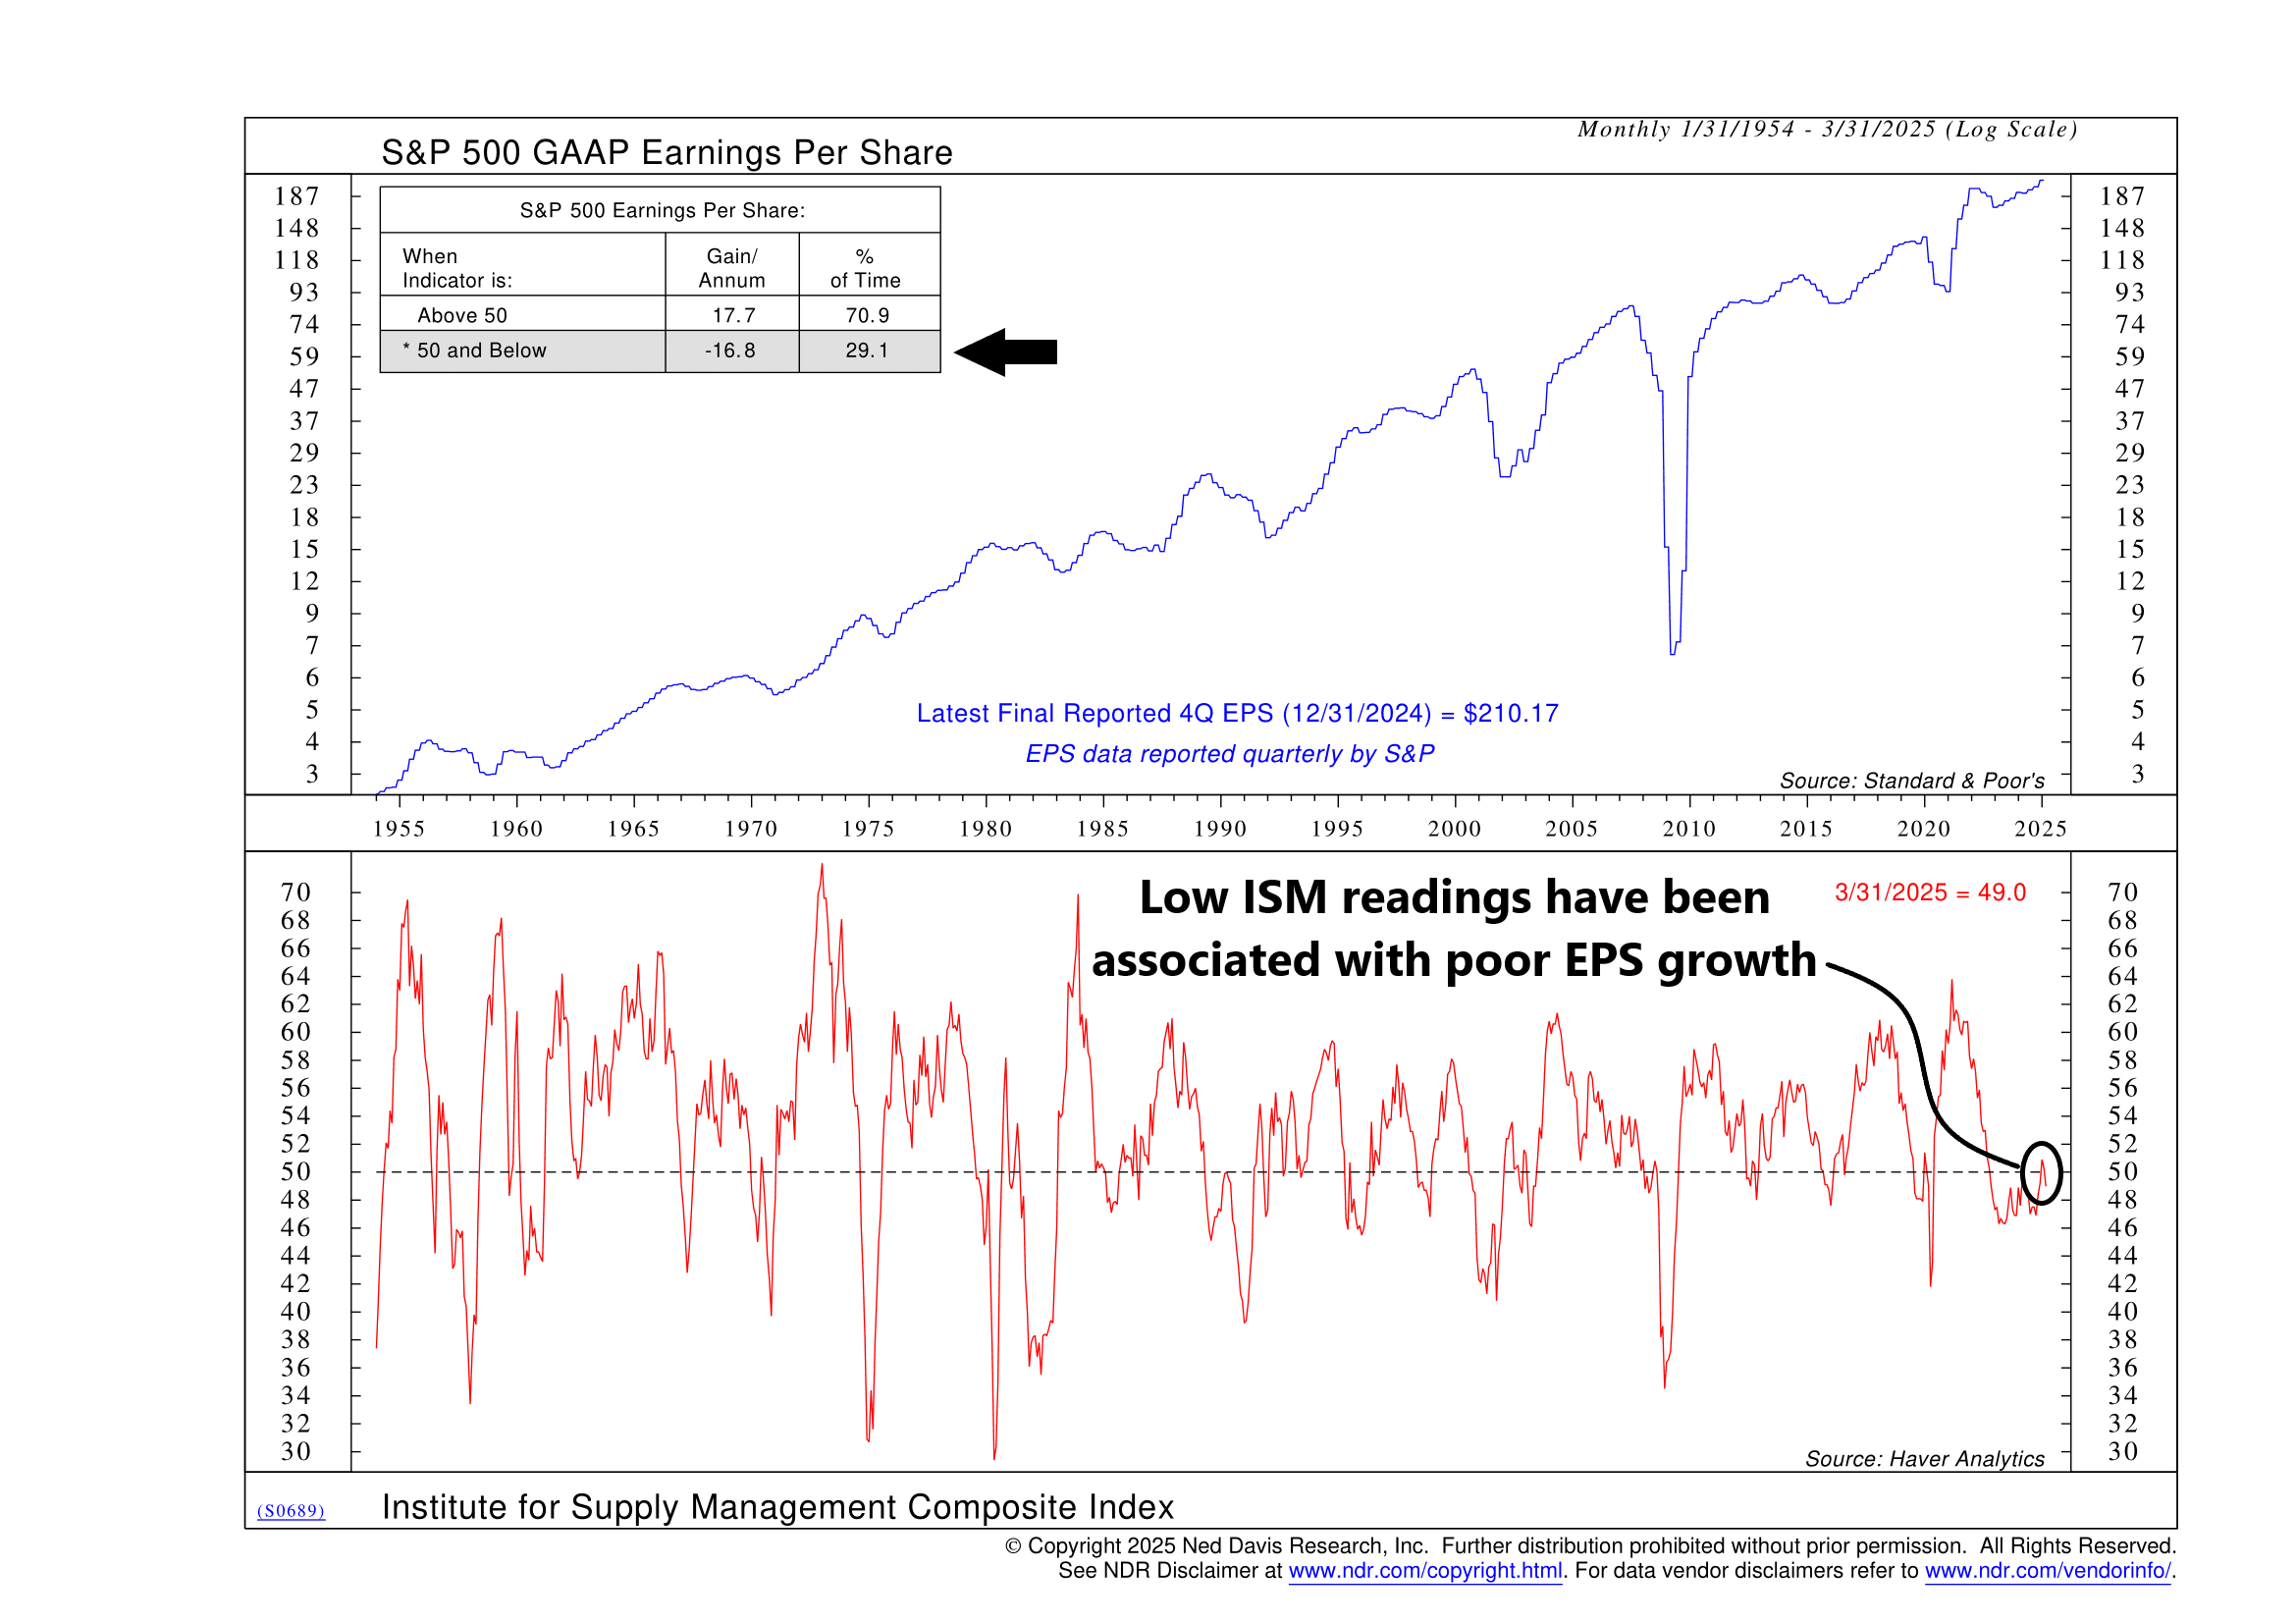
At the top of the chart, we see the S&P 500’s GAAP earnings per share—these are the real deal numbers, reported under standard accounting rules and reflecting what companies actually earned. As of the most recent report, earnings clocked in at $210.17 for the trailing four quarters, which marks a solid recovery from the pandemic-era lows. But earnings don’t rise in a vacuum. What drives them, at the most basic level, is economic activity. That’s where the ISM index comes in.
The bottom portion of the chart shows the Institute for Supply Management (ISM) Composite Index—a survey-based reading of manufacturing activity. It’s a diffusion index, so readings above 50 suggest expansion, while readings below 50 point to contraction. Historically, this index has been a reliable leading indicator for earnings. When manufacturing is humming, profits tend to follow. When it stalls out, earnings often feel the pain.
After hitting a cycle low in mid-2023, the ISM index crept back above 50 early this year, offering a glimmer of hope that maybe the worst was behind us. But that hope has faded quickly. The most recent reading (as of March 31, 2025) came in at 49.0—just below the critical 50 line and back into contraction territory.
Why does that matter? The box in the upper left corner explains it all. When the ISM index is above 50, S&P 500 earnings have historically grown at an annualized pace of +17.7%. But when the index drops below 50, the picture flips: earnings have contracted at an average rate of -16.8%. That’s a big difference. It’s the kind of swing that matters for things like stock valuations, investor sentiment, and market leadership.
So what does this mean going forward? Despite the strong headline number in GAAP earnings, the ISM’s recent stumble is a warning flag. It suggests that the foundation under those earnings may be softening. If manufacturing momentum continues to fade, we may see that start to bleed into corporate profits in the quarters ahead.
The bottom line: earnings have recovered nicely, but they’re now facing headwinds from the real economy. Keep an eye on the ISM. If it can’t regain altitude, earnings growth could struggle to stay on track.
This is intended for informational purposes only and should not be used as the primary basis for an investment decision. Consult an advisor for your personal situation.
Indices mentioned are unmanaged, do not incur fees, and cannot be invested into directly.
Past performance does not guarantee future results.
The S&P 500 Index, or Standard & Poor’s 500 Index, is a market-capitalization-weighted index of 500 leading publicly traded companies in the U.S.