In baseball, there’s a concept known as the “five-tool player.” It’s used to describe a player that excels at all five of the major skills that scouts generally look for: speed, throwing, fielding, hitting for average, and hitting for power.
One definition of breadth is “wide range or extent.” So, you could say a five-tool player has breadth.
This concept also applies to investing. When the stock market is rallying, we prefer to see many stocks participating in the rally, not just a few big names. In other words, we want the market to have breadth (i.e., to use all its tools). If breadth is lacking, it’s a sign of an unhealthy market.
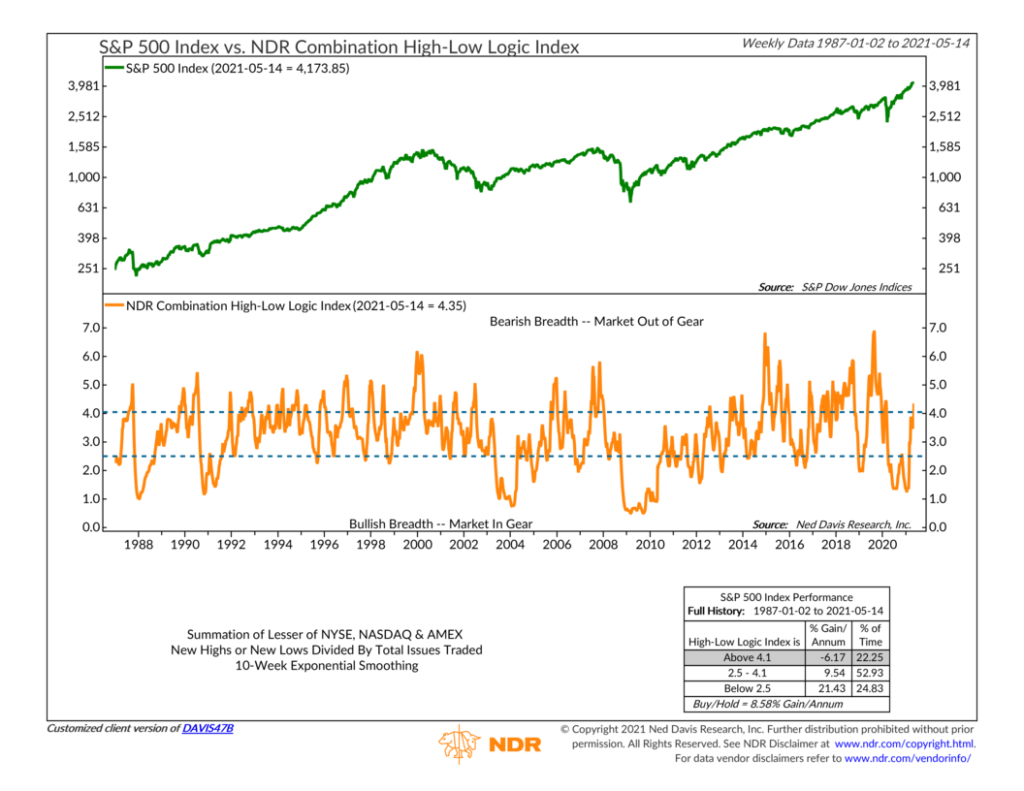
Our featured indicator above blends this concept into something called a High-Low Logic Index. At its core, it’s basically a measure of how in gear, or bullish, the market is. It uses just two criteria to accomplish this: the number of stocks hitting new 52-week highs and the number of stocks breaking down to new 52-week lows.
The technical calculation is as follows: add up the lesser of the NYSE, NASDAQ, and Amex new highs or new lows and divide by the total issues traded (and then apply a 10-week exponential moving average).
But that’s confusing. Let’s break it down in plainer terms. The market is considered in gear when new 52-week highs are much greater than new 52-week lows. But it is also in gear when new 52-week lows are overwhelming new 52-week highs. This is because, in either case, very few stocks are diverging from the prevailing trend. When many stocks are making new highs with very few making new lows, the market is demonstrating strong upside momentum. This is bullish. But if a lot of stocks are making new lows with few making new highs, it likely means a selling climax has left the market oversold. This is also bullish. In either case, the High-Low Logic line will be low (below the lower dashed line on the chart).
The rest of the time, however, the indicator is either neutral (between the dashed lines) or out of gear (above the upper dashed line, and therefore bearish). A market with widespread divergence—a lot of new highs and new lows at the same time—is like a person who just woke up in the morning: It has bad brea(d)th. Historically, you’d have wanted to stay away from stocks at times like this.
Looking at the chart, we can see that before many of the major selloffs in recent stock market history (the 2000 Tech Bust, the 2008 Financial Crisis, and the 2020 Virus Crisis), the High-Low Logic Index had reached historically high levels prior to the crashes, warning that the market was out of gear. Subsequently, the indicator reached extremely low levels after the selling pressures had subsided, signaling great buying opportunities. For just one indicator, I’d call that a home run!
This is intended for informational purposes only and should not be used as the primary basis for an investment decision. Consult an advisor for your personal situation.
Indices mentioned are unmanaged, do not incur fees, and cannot be invested into directly.
Past performance does not guarantee future results.