The stock market tends to go up over time. But there are times when it goes up too high, too fast. When this happens, a correction tends to occur, meaning stocks drop at least 10% from a recent high.
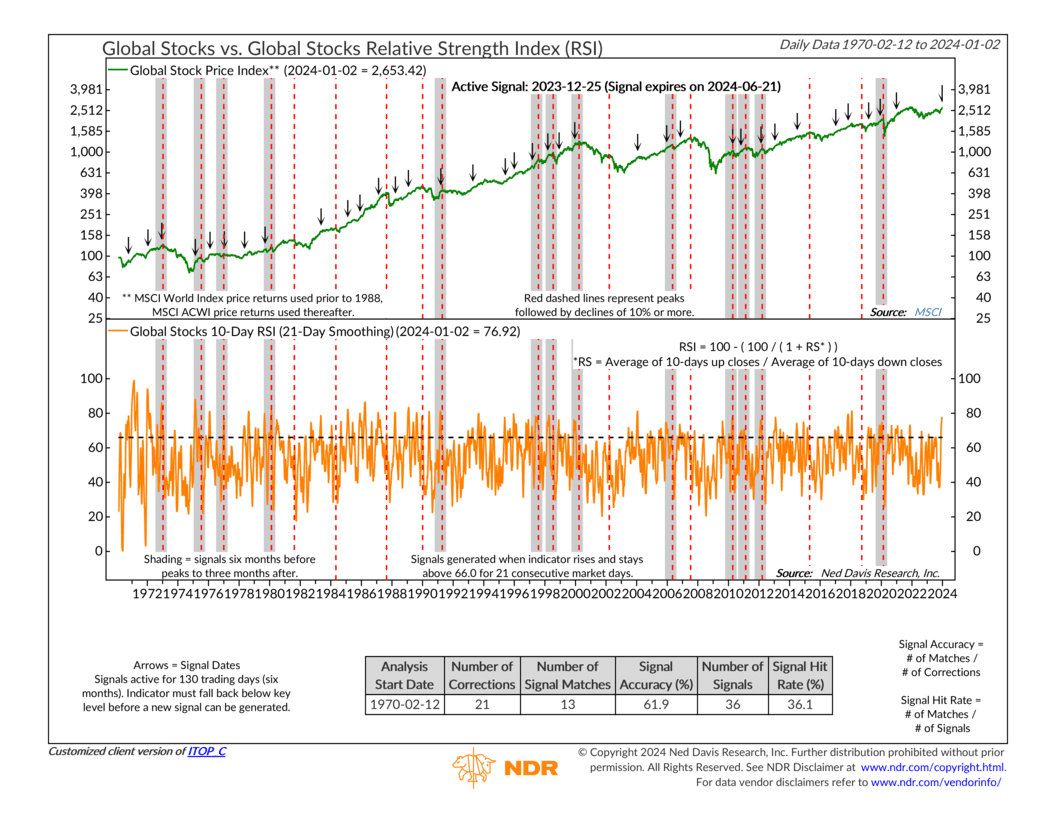
We don’t always know when a correction is about to occur. But this week’s indicator, the Global Stocks Relative Strength Index, can perhaps give us a slight edge. It uses a fancy calculation called the RSI momentum oscillator to determine where the stock market is trading relative to its recent past. Specifically, it takes the 21-day average of the 10-day RSI. This is the orange line on the indicator above.
When this measure goes above the upper dashed line on the chart, it’s a sign that the global stock market (the green line) has become overbought. If it stays above this line for 21 consecutive trading days, a sell signal is triggered. Basically, it’s a warning that the stock market has gone up too fast, and a correction might be on the way.
How good is this indicator? Well, the red dashed lines on the chart show every correction in the MSCI global stock market index since 1970 (a drop of 10% or more from a peak). The downward arrows indicate sell signals from the indicator, and the shaded areas show sell signals during a correction. Turns out, of the 21 corrections since 1970, the indicator predicted about 62% of them – not bad.
But here’s the catch: there were a total of 36 sell signals and only 13 of them coincided with a correction. So, it gives a lot of false alarms. That 36% hit rate doesn’t mean the indicator is useless; it just suggests it’s best used alongside other indicators to filter out those false alarms.
What’s the indicator saying now? Well, on Christmas day (12/25/2023), it produced a sell signal – the first since 2020. Does this mean a correction is coming? Maybe. According to the history of the indicator, there’s about a 1 in 3 chance of a global stock market correction occurring in the next 6 months or so.
That shouldn’t have you running for the hills or anything, but it might help adjust expectations as we head into the new year.
This is intended for informational purposes only and should not be used as the primary basis for an investment decision. Consult an advisor for your personal situation.
Indices mentioned are unmanaged, do not incur fees, and cannot be invested into directly.
Past performance does not guarantee future results.
The MSCI World Index captures large and mid-cap representation across 23 Developed Markets (DM) countries*. With 1,509 constituents, the index covers approximately 85% of the free float-adjusted market capitalization in each country. The MSCI ACWI captures large and mid cap representation across 23 Developed Markets and 24 Emerging Markets countries. With 2,935 constituents, the index covers approximately 85% of the global investable equity opportunity set.