For this week’s featured indicator, I’d like to revisit a tool we use to measure the long-term “trend” or direction of the stock market.
It’s called a deviation-from-trend indicator. It gets this name because it looks at how the stock market is trending over two different periods—one short and one long—and determines how much one deviates from the other.
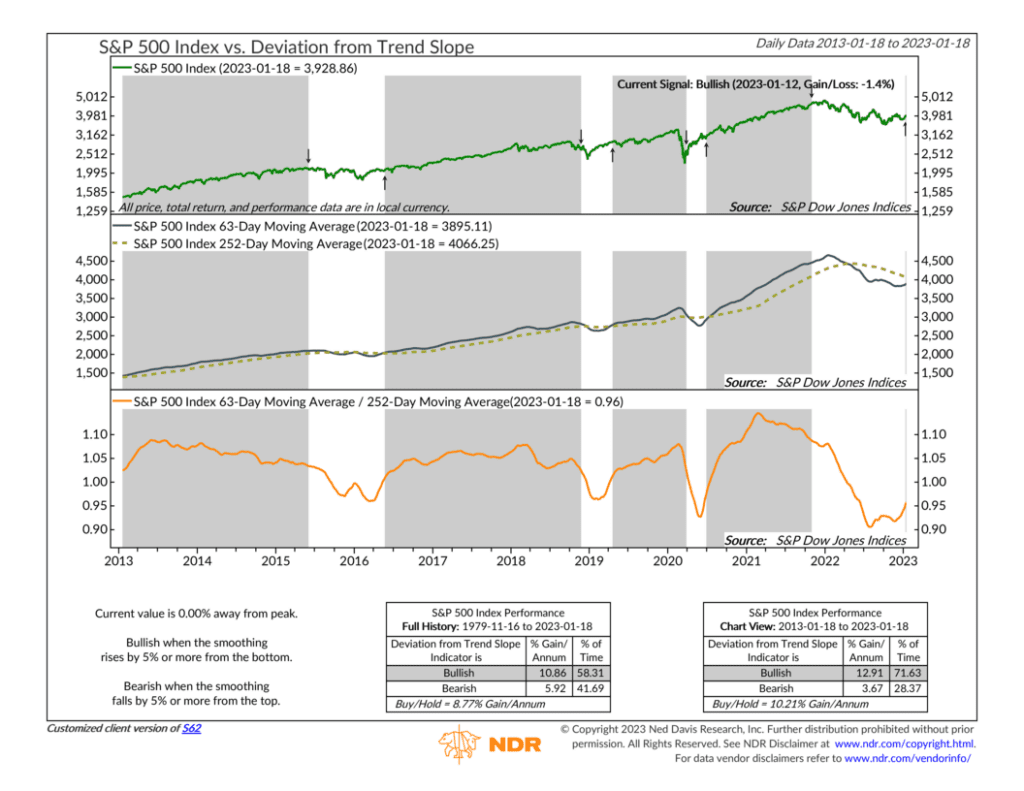
To get the indicator, we must first calculate the two trend periods for the S&P 500 stock index. The shorter-term trend is calculated as the average price of the index over the past 3 months (63 trading days), and the longer-term trend is the average price over the past year (252 trading days). These two trend periods are shown in the middle clip of the chart.
But to be precise with our analysis, we divide the shorter-term trend by the longer-term trend to produce the orange line on the bottom clip of the chart. This is the important line to focus on. When this line is rising, it means prices in the near term are rising faster than prices in the long term. Typically, you see this when the market is heating up, and a bullish trend is forming. On the other hand, when the line is falling, it probably means the stock market is cooling off, and a downtrend is developing.
Historically, the best returns for the S&P 500 have come after this indicator has risen by 5% or more from a bottom, and the worst returns have occurred after a 5% or more fall from a top.
For example, the most recent sell signal appeared in November 2021, right before the market saw a massive downswing that lasted all of 2022. You can see how the orange line actually peaked around March 2021, a sign that the trend had reached a point of exhaustion and that a potentially bearish trend was forming.
Fast forward to today, however, and we now see signs that a bullish trend is trying to form. The orange line bottomed out in the summer of last year and has now risen by 5% from that low. If the price action stays firm, it could signify that a potentially new bullish trend is forming.
The bottom line? This is just one indicator, but it’s an important piece of the overall system and helps us gauge the stock market’s long-term trend. We’ll be watching to see if this and other indicators can shift the weight of the evidence in a more favorable direction in 2023. A bullish signal from this indicator is a good start, but there is likely more work to be done.
This is intended for informational purposes only and should not be used as the primary basis for an investment decision. Consult an advisor for your personal situation.
Indices mentioned are unmanaged, do not incur fees, and cannot be invested into directly.
Past performance does not guarantee future results.