Does government policy matter to the stock market? According to our featured indicator this week—the Real Monetary, Fiscal, and Exchange Rate Policy Index—the answer is a resounding yes.
The policy index is a combination of the year-to-year change of the real (inflation-adjusted) M2 money supply and the year-to-year change of the 12-month trailing total of real federal expenditures. It also subtracts out the 12-month total of real federal receipts and the year-to-year change in the U.S. dollar. In other words, it combines the growth rates of the money supply, federal government spending, and the dollar into a single measure. Taken together, these three factors measure the total stimulus that is being provided to our economy.
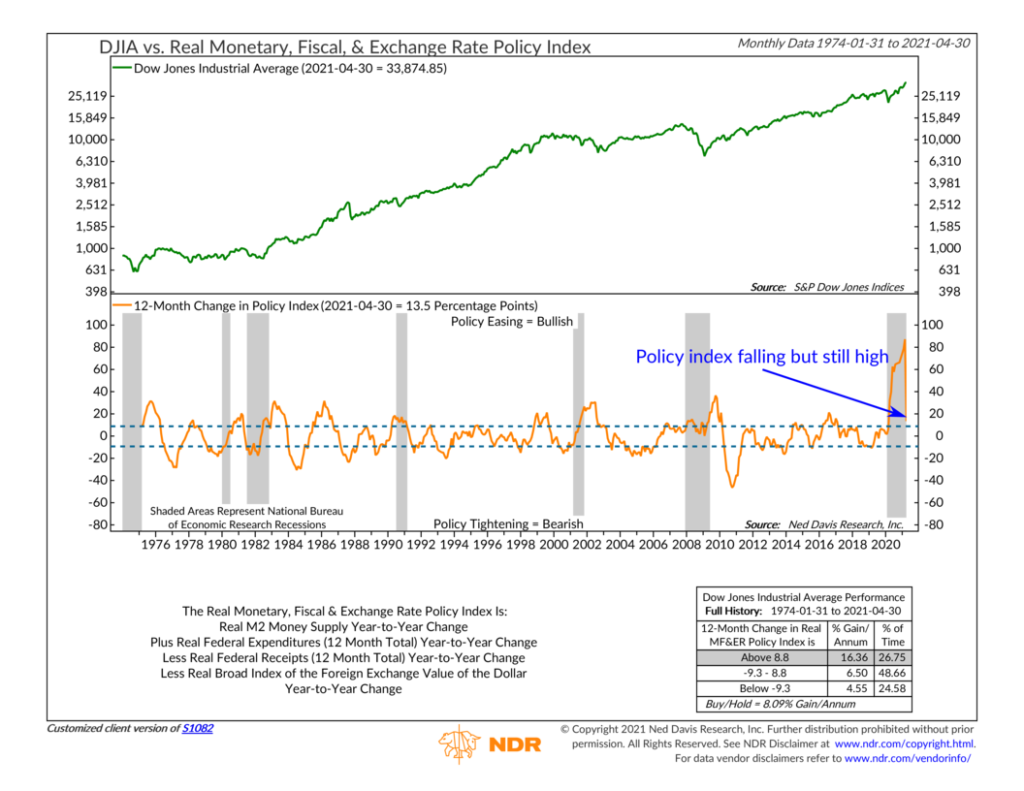
The 12-month change in the policy index is shown as the orange line at the bottom of the chart. The green line up top shows the performance of the Dow Jones Industrial Average (the stock market) going back to 1974. Historically, we find that when the policy index turns up and is higher than it was 12 months ago (the indicator is above the upper bracket), the market benefits from the expansionary policy and returns around 16% per year, on average. However, when the policy index falls below its level a year ago (the indicator is below the lower bracket), the market does poorly as it sees contractionary policy coming.
This past year really stands out on the chart as both monetary and fiscal policy expanded together at unprecedented rates to combat the pandemic. As a result, both the money supply and federal government spending skyrocketed, and the U.S. dollar entered a downturn. Sure enough, the policy index triggered a positive signal for the stock market at the end of March 2020, and stocks have surged ever since.
As you might notice, the policy index has come down quite a bit after reaching an all-time high a few months ago. But that is to be somewhat expected, as the indicator measures the year-to-year change in the money supply and government spending, which would have looked largest this March—a year after the initial downturn and subsequent massive government response in spending. At 13.5%, the 12-month change in the policy index last month is still above the upper bracket, indicating an easy monetary, fiscal, and exchange rate environment that is bullish for stocks.
This is intended for informational purposes only and should not be used as the primary basis for an investment decision. Consult an advisor for your personal situation.
Indices mentioned are unmanaged, do not incur fees, and cannot be invested into directly.
Past performance does not guarantee future results.