We’ve talked about stock market volatility in the past and how we can use tools like the VIX Index to gauge stock market risk. But what about bond market volatility? Can that be used to call stocks?
The answer, according to this week’s indicator, is yes!
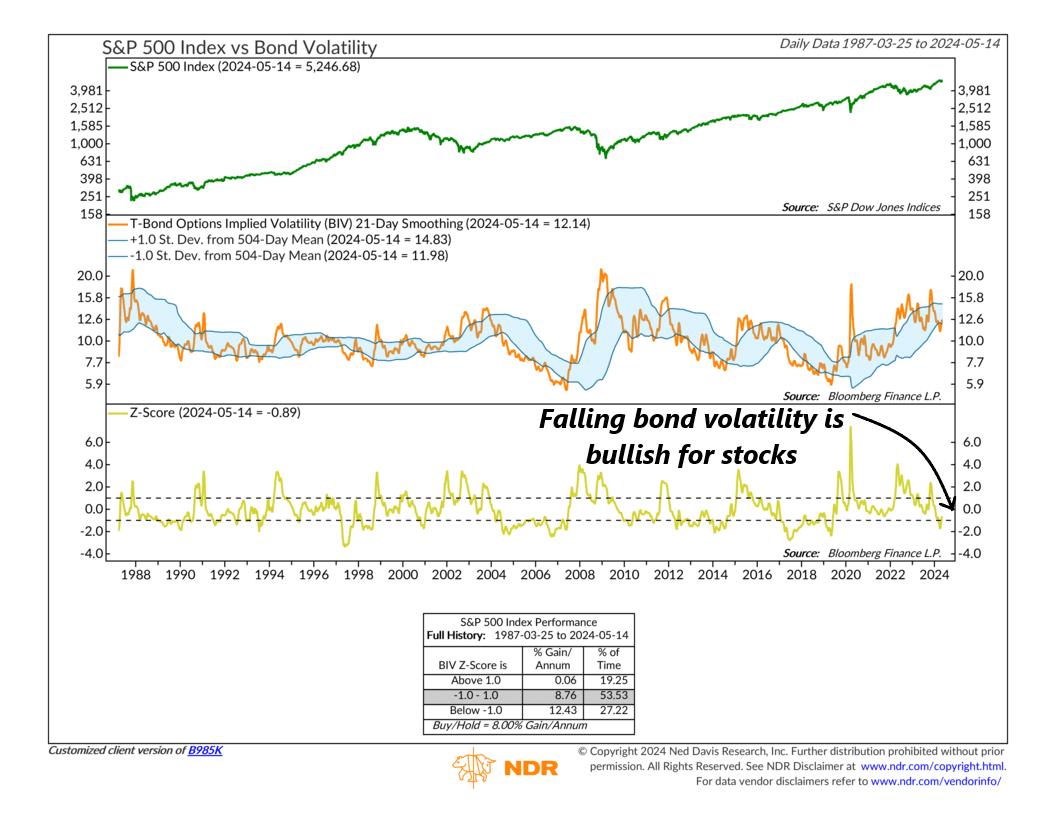
The chart above measures Treasury Bond Implied Volatility, which is the expected volatility of the price of a Treasury bond inferred from the prices of options on that bond. In other words, it measures how much the market thinks bond prices might swing based on options trading.
Specifically, the orange line in the middle clip measures the 21-day average of T-Bond implied volatility, and the moving brackets surrounding that represent +/- 1 standard deviation from the 2-year average.
To see how far away the implied volatility is from the average, we utilize a z-score, shown on the bottom clip. When the z-score has gotten above 1 historically, it’s been a sign of extreme bond volatility. As the performance box shows, that has corresponded with poor stock market returns, with the S&P 500 Index (green line, top clip) trading essentially unchanged.
On the other hand, however, when the z-score dips below -1, it’s a sign that bond volatility is extremely low compared to its 2-year average. Stocks have liked that historically, with the S&P 500 rising over 12% per year on average with the indicator in this zone.
We reached this lower bullish zone earlier this year, as bond market volatility has calmed down quite a bit compared to the past two years. We have seen a slight pickup in recent weeks, however, so this bullish sentiment towards stocks should probably be tempered somewhat.
The bottom line, though, is that stocks thrive when the bond market stabilizes and volatility decreases. This indicator highlights the importance of monitoring bond volatility because, more often than not, shifts in the bond market precede movements in the stock market.