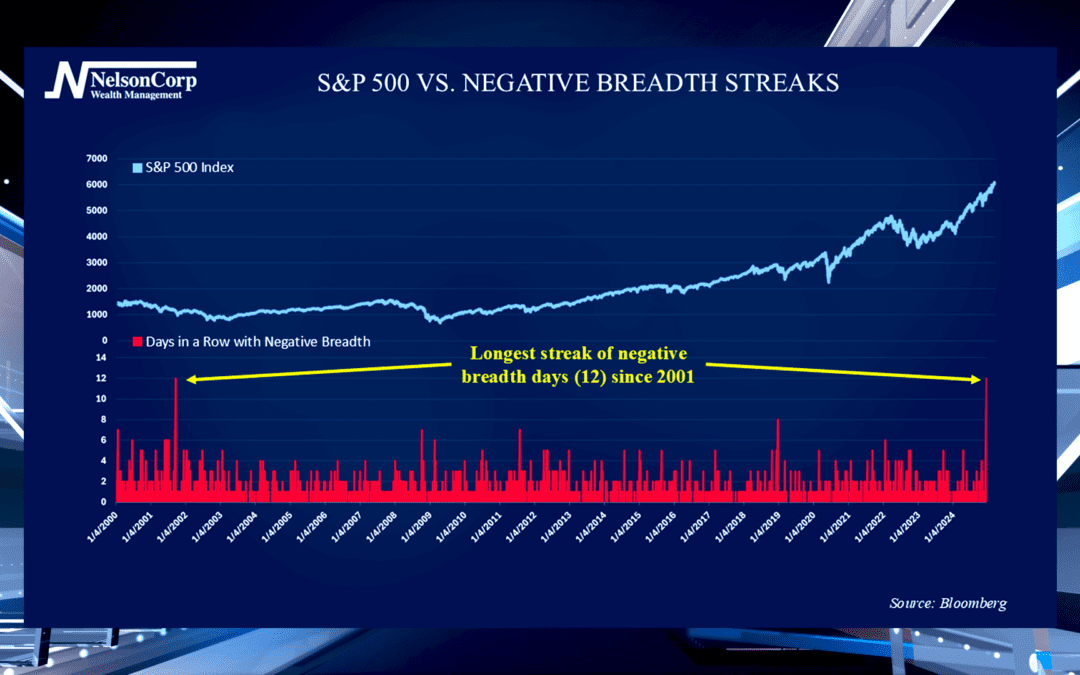
Breadth Breakdown
As 2024 is coming to an end, many investors are keeping an eye on the stock market as changes can occur rapidly. David Nelson joins us to share the importance of noting advancers versus decliners and how a balanced market is best for all.
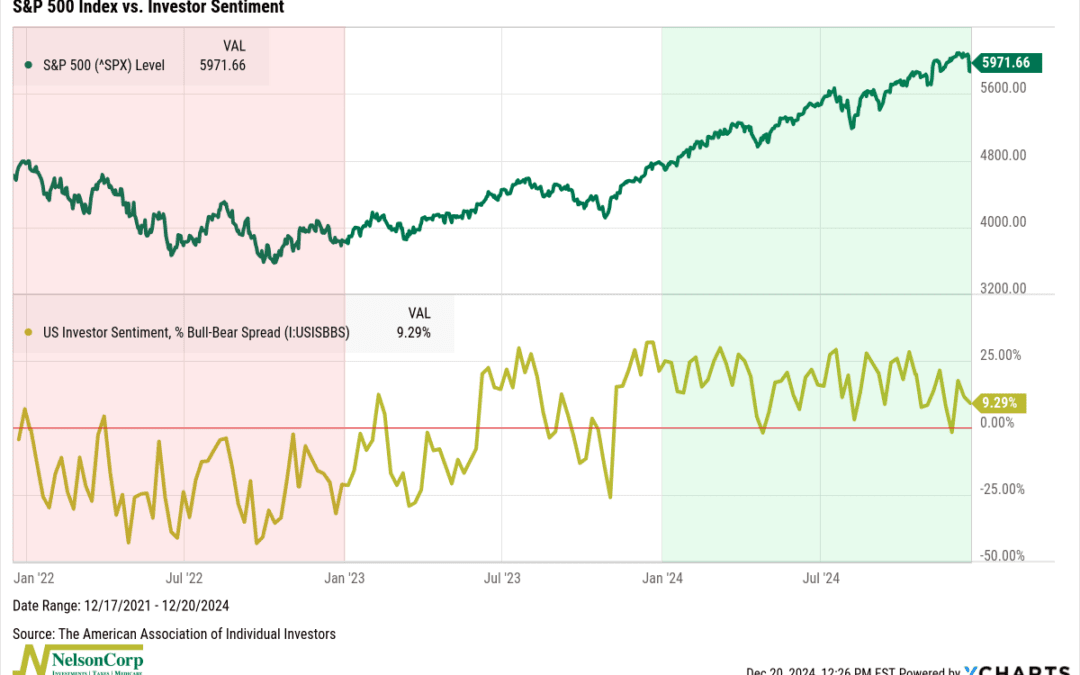
Soaring Sentiment—but Who’s Pulling the Sled?
Investor sentiment has been as cheerful as holiday lights this year, fueling consistent market gains. But with fewer stocks pulling the market’s weight, the rally feels more like Santa’s sleigh running low on reindeer—still moving, but for how long?
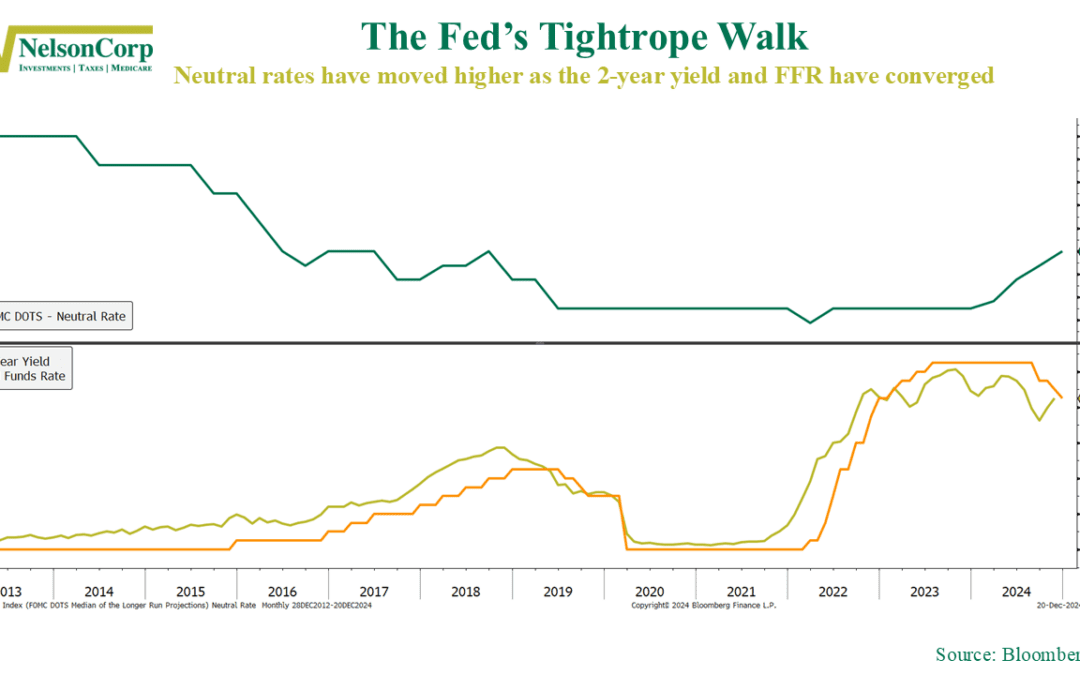
Neutral Shift
The Federal Reserve shook up financial markets this week, with stocks sliding after yet another rate cut. But it wasn’t the cut itself that rattled investors—it was the Fed’s revised projection for the “neutral rate,” shown in green on the chart. This neutral...