by NelsonCorp Wealth Management | Jan 30, 2025 | Indicator Insights
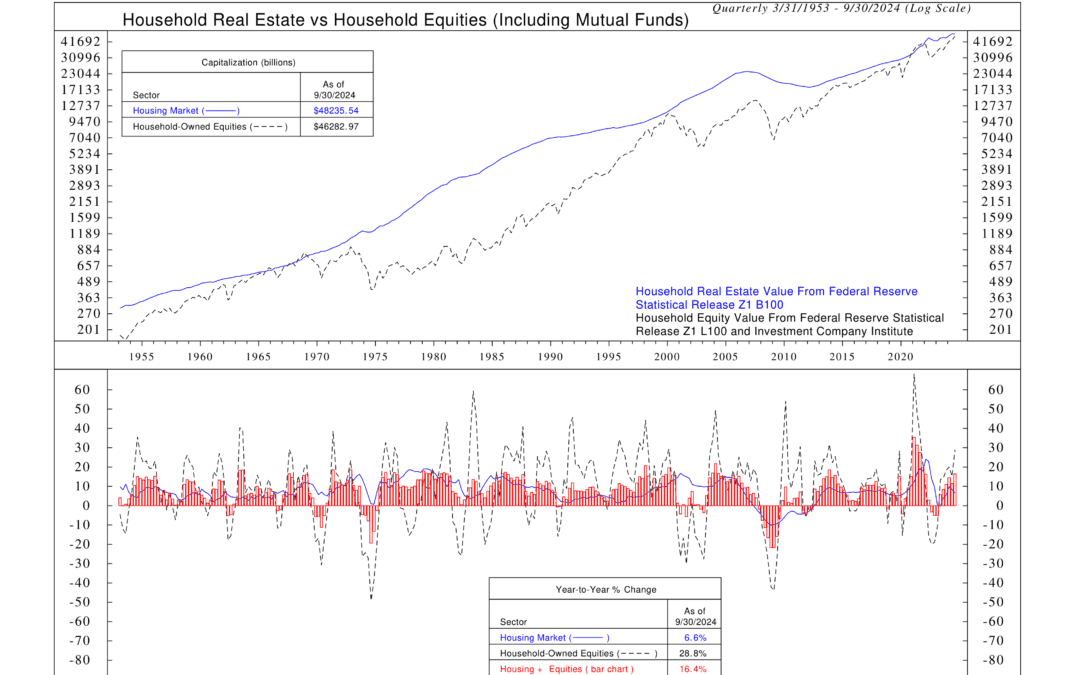
Some say the economy is on shaky ground. They point to high interest rates. They talk about inflation. They worry about a slowdown. But if you look at household wealth, you’d see a different story. This week’s indicator, Household Real Estate vs. Household...
by NelsonCorp Wealth Management | Jan 23, 2025 | Indicator Insights
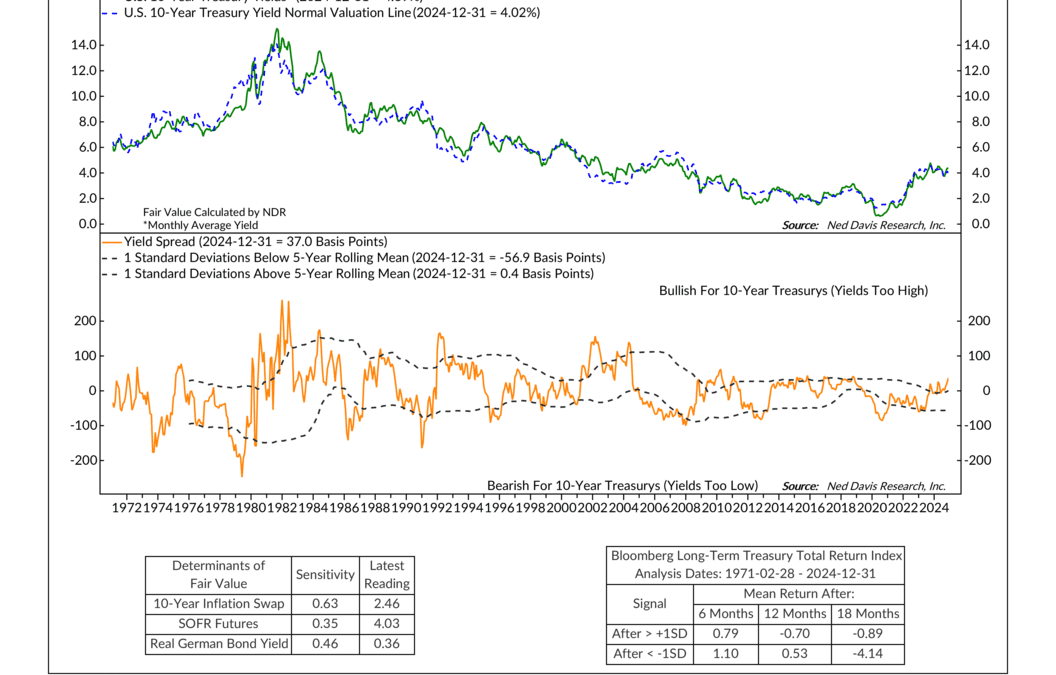
This week’s indicator focuses on the U.S. 10-Year Treasury Fair Value Model, a tool designed to gauge whether 10-year Treasury yields are too high, too low, or just right. With interest rates playing such a pivotal role in the markets, knowing when Treasuries...
by NelsonCorp Wealth Management | Jan 16, 2025 | Indicator Insights
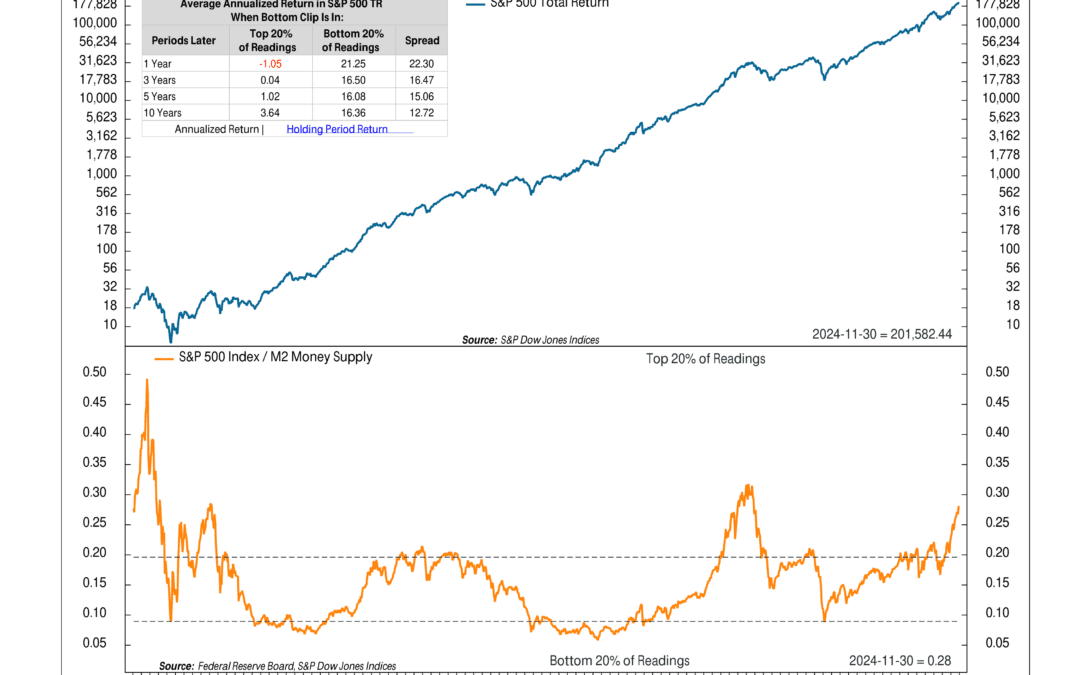
The stock market needs money to thrive. OK, maybe that’s an obvious statement. But what I mean is that the economy’s money supply needs to grow at a rate consistent with stock prices. When it doesn’t, returns often suffer. This week’s indicator explains why. At...
by NelsonCorp Wealth Management | Jan 9, 2025 | Indicator Insights
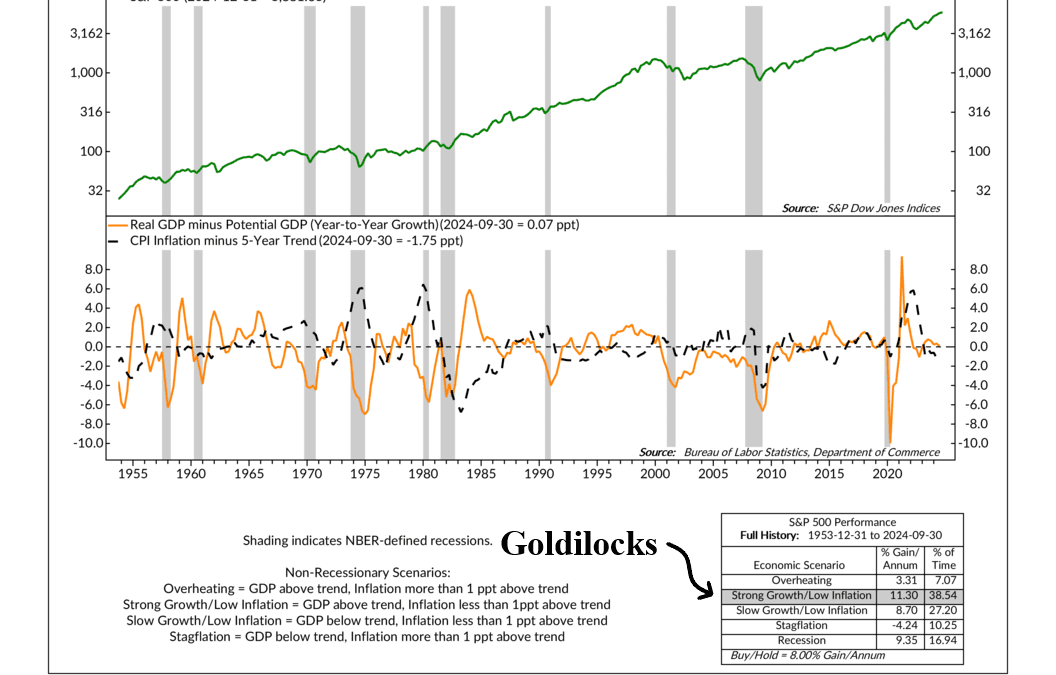
This week’s indicator is all about regimes. Markets, much like history, operate in distinct regimes, and for the stock market, the two biggest drivers of these cycles are economic growth and inflation. Together, they set the stage for the economic scenario the...
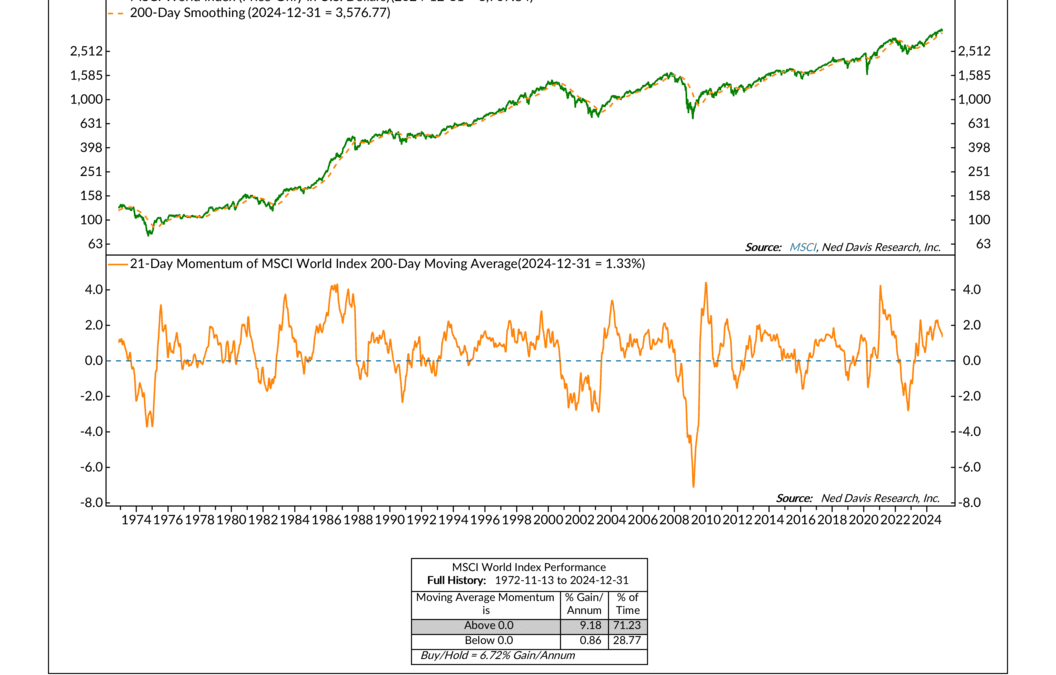
by NelsonCorp Wealth Management | Jan 2, 2025 | Indicator Insights
This week, we’re diving into a powerful chart: the MSCI World Index vs. the 21-Day Momentum of its 200-Day Moving Average. Don’t let the technical name intimidate you—this tool simply helps us stay in sync with the market’s long-term momentum. The chart...
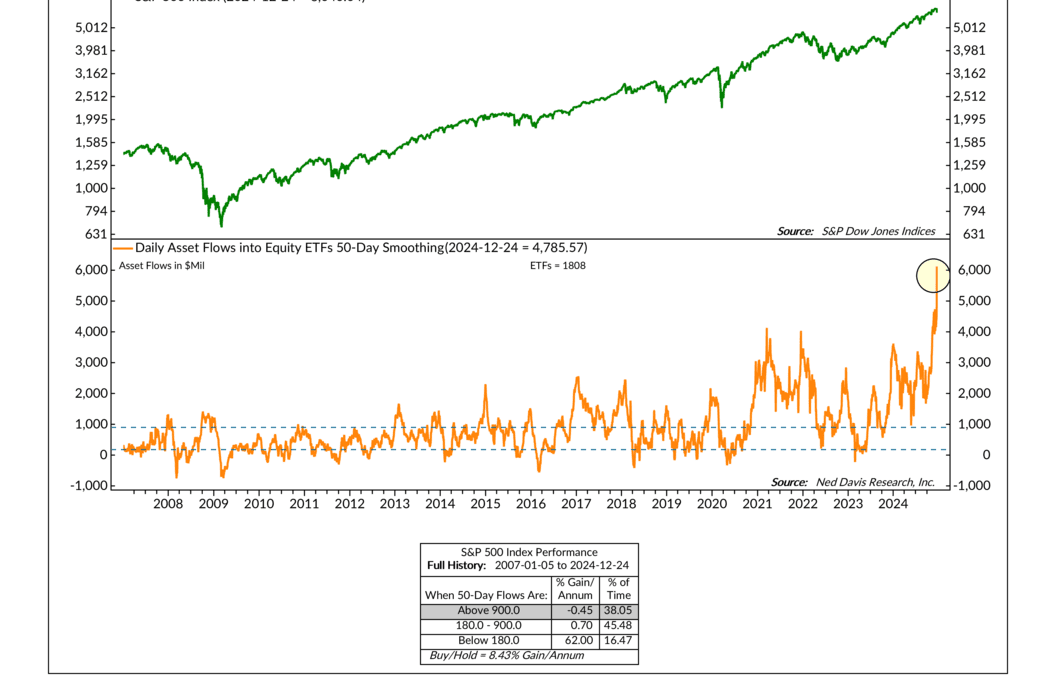
by NelsonCorp Wealth Management | Dec 26, 2024 | Indicator Insights
In this week’s indicator, we’re taking a closer look at equity ETF flows—and the story they’re telling is hard to ignore. The chart above tracks the 50-day average of daily inflows into U.S. stock funds. This metric smooths out day-to-day noise and gives us a...