
by NelsonCorp Wealth Management | May 30, 2024 | Indicator Insights
When a bunch of stocks skyrocket at the same time, in a strong and sudden fashion, we call it a breadth thrust. It’s a good thing for the overall stock market, as it’s a sign of a healthy and robust environment. Typically, when the market is in the beginning...
by NelsonCorp Wealth Management | May 23, 2024 | Indicator Insights
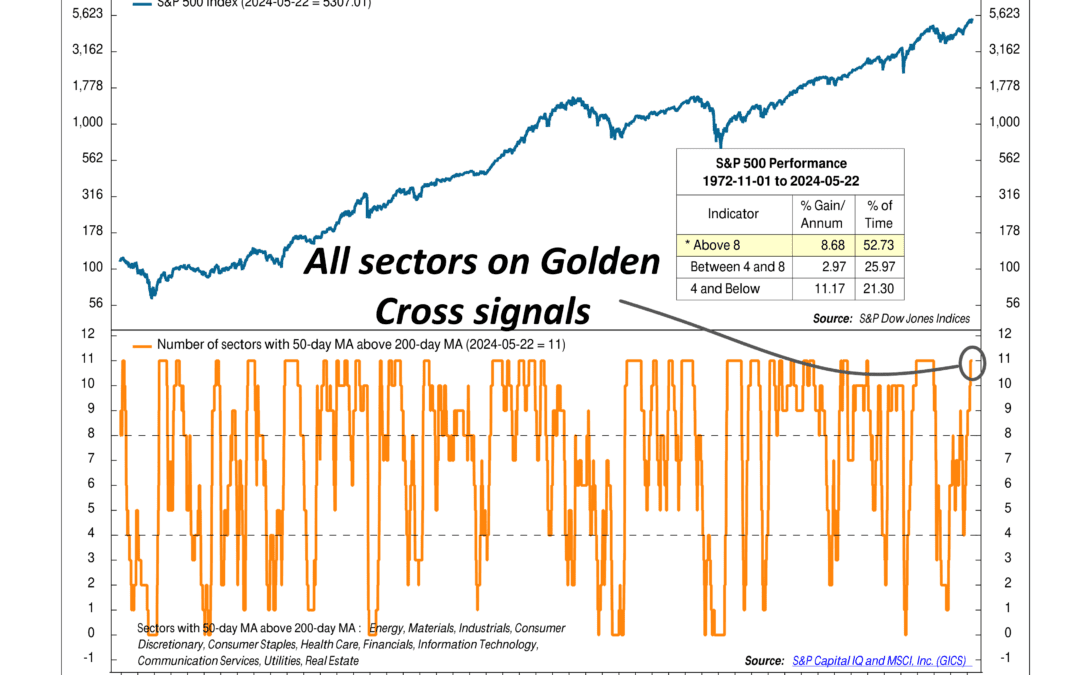
This week’s indicator uses a tool called a golden cross. A golden cross happens when a financial asset’s short-term moving average crosses above its long-term moving average, signaling a bullish trend with increasing momentum. Typically, we look at the...
by NelsonCorp Wealth Management | May 16, 2024 | Indicator Insights
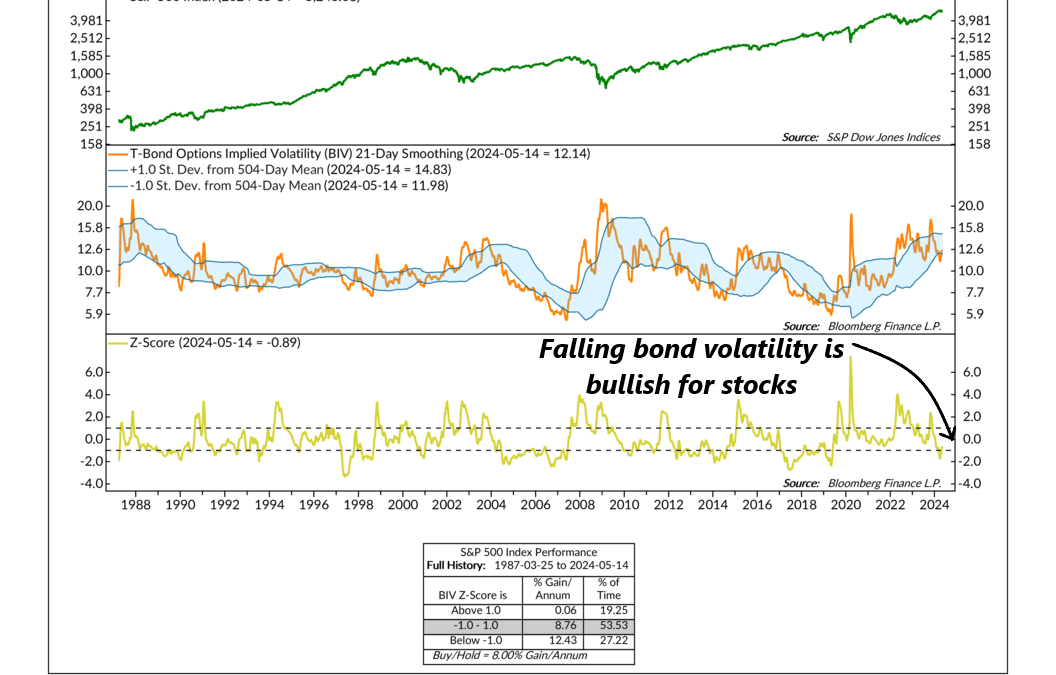
We’ve talked about stock market volatility in the past and how we can use tools like the VIX Index to gauge stock market risk. But what about bond market volatility? Can that be used to call stocks? The answer, according to this week’s indicator, is yes! The...
by NelsonCorp Wealth Management | May 9, 2024 | Indicator Insights
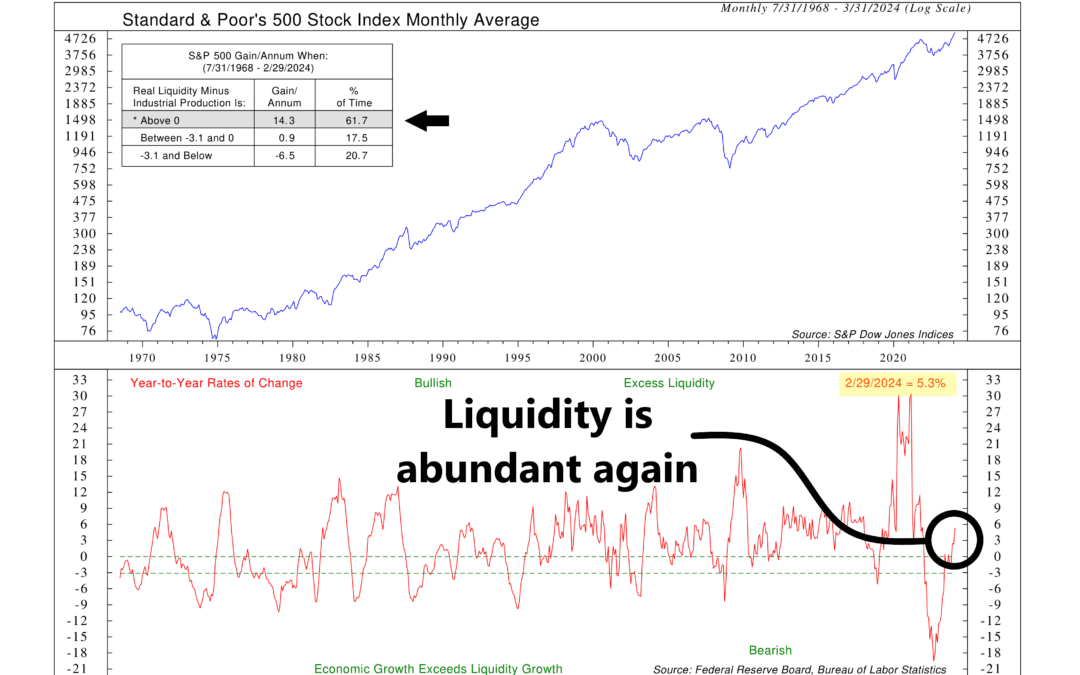
The famous investor Stanley Druckenmiller once quipped that what really moves the market is liquidity, or the availability of cash, rather than earnings or other traditional factors. Whether that is true or not could be debated, but it does make sense that if...
by NelsonCorp Wealth Management | May 2, 2024 | Indicator Insights
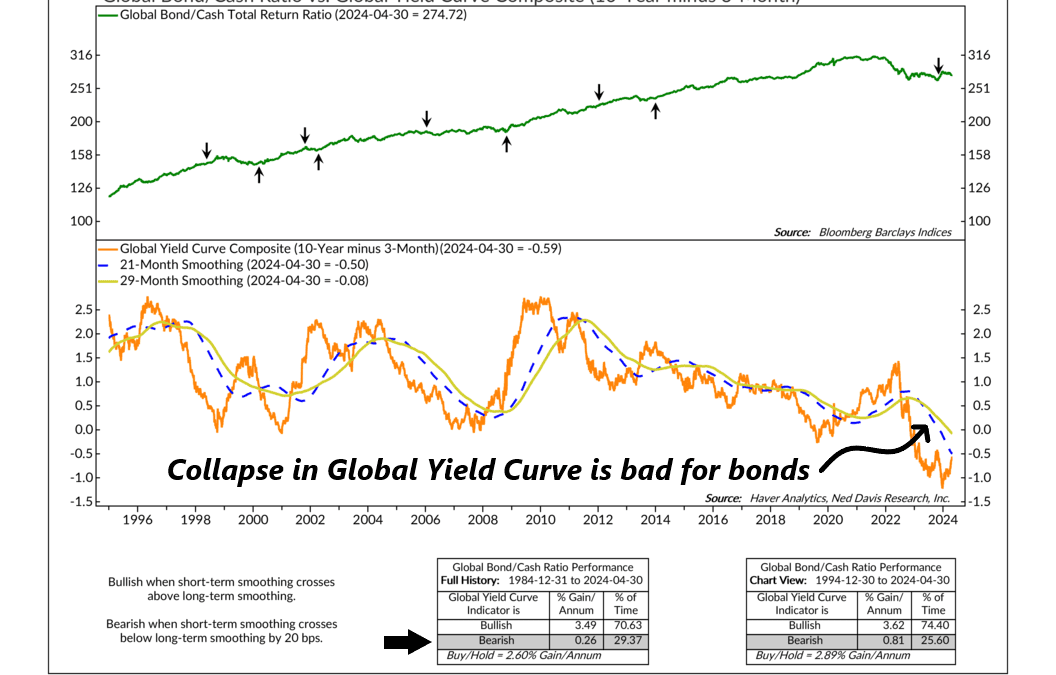
Let’s take a look at this week’s featured indicator, the global yield curve, and how we use it to figure out whether it’s better to invest in bonds or stick with cash. This indicator’s primary metric is something called the Global Yield Curve Composite....
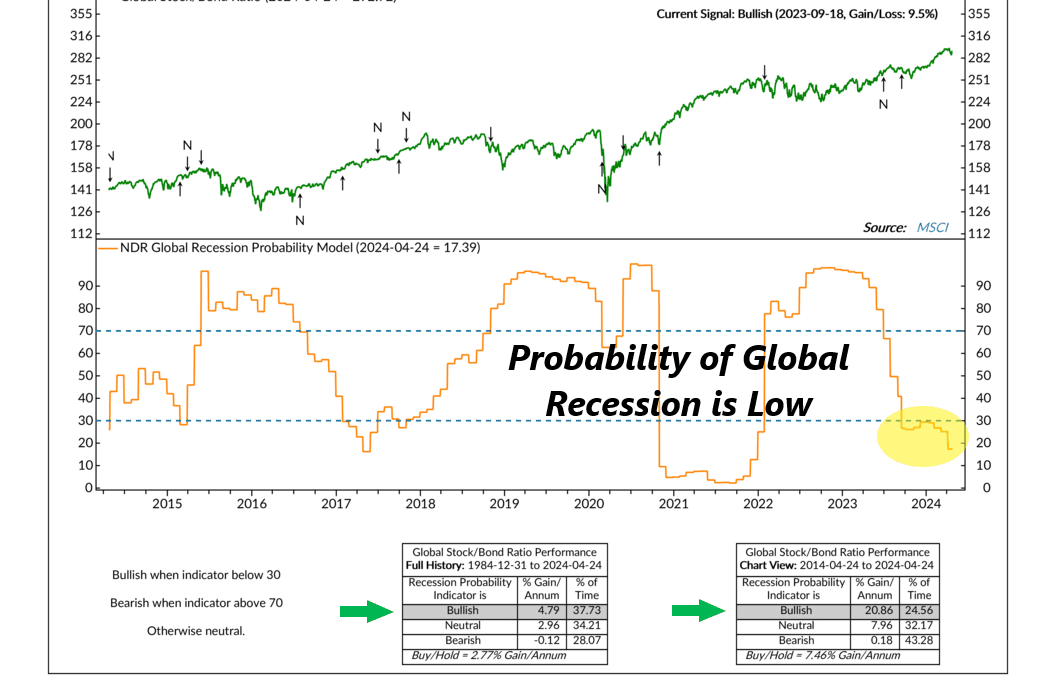
by NelsonCorp Wealth Management | Apr 25, 2024 | Indicator Insights
A Recession, or a sustained slowdown in economic growth, is one of the worst things that can happen to the stock market. The problem? Recessions are hard to predict. Hard, but not impossible. We can still get close by assigning a probability to a recession...